
Logistics KPI Dashboard & Reporting SetupChan Ling Liu
I build clear, automated KPI dashboards for logistics and fulfillment teams. My dashboards track on-time delivery, carrier performance, exceptions, and warehouse accuracy—designed for fast weekly reporting. With multi-warehouse experience, I turn complex operations data into clean visuals you can actually use.
What's included
Logistics KPI Dashboard (Google Sheets or Excel)
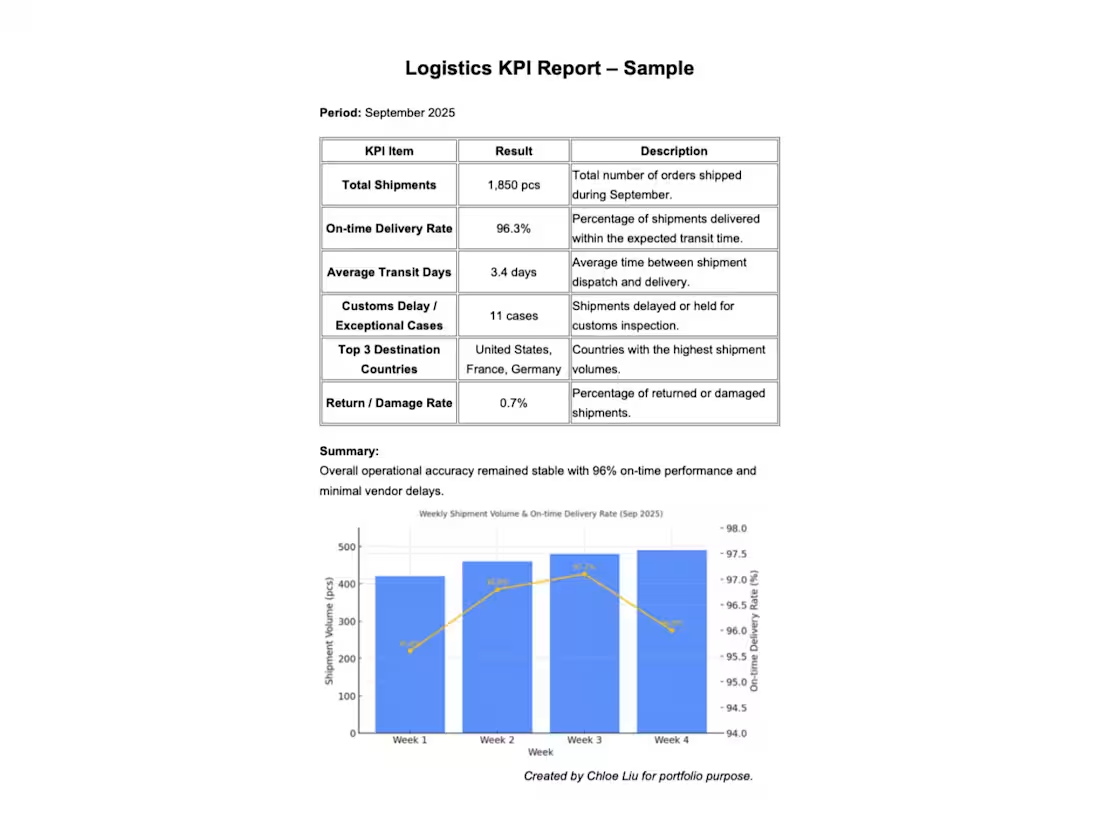
A complete, automated dashboard showing key logistics KPIs including on-time delivery rate, transit time trends, exception categories, warehouse accuracy, and high-level operational performance.
Weekly Performance Report Template
A clean, export-ready weekly report (PDF or Sheets) summarizing shipment delays, fulfillment issues, and operational highlights for internal team updates or stakeholder communication.
Delay & Exception Analysis Sheet
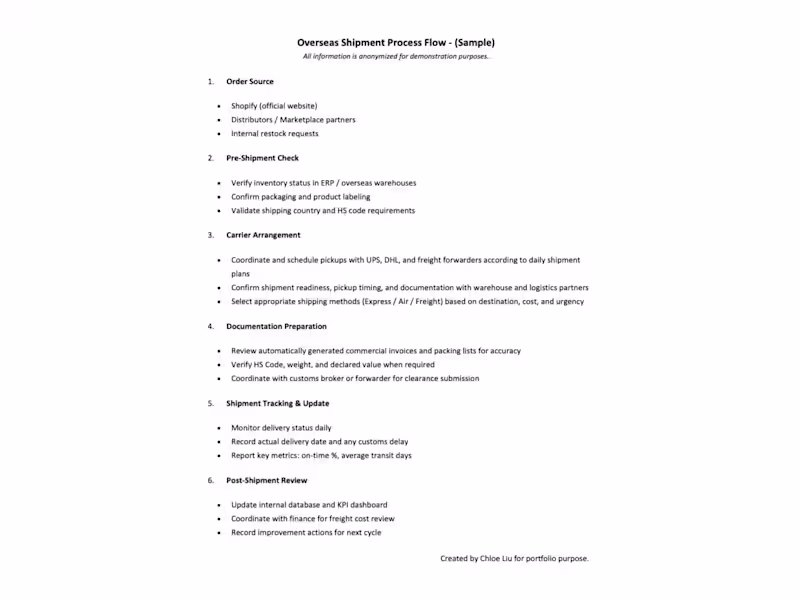
A detailed sheet categorizing delay reasons, exception types, affected regions, carrier-level issues, and operational root causes to support weekly problem-solving.
KPI Dashboard User Guide
A concise guide explaining KPI definitions, dashboard logic, color indicators, and how to update or expand the dashboard with future data.
FAQs
Starting at$300
Duration3 days
Tags
ClickUp
Google Sheets
Microsoft Excel
Microsoft Power BI
Notion
Consultant
Data Analyst
Operations Manager
Service provided by
Chan Ling Liu Taichung, Taiwan
- 2
- Followers
Logistics KPI Dashboard & Reporting SetupChan Ling Liu
Starting at$300
Duration3 days
Tags
ClickUp
Google Sheets
Microsoft Excel
Microsoft Power BI
Notion
Consultant
Data Analyst
Operations Manager
I build clear, automated KPI dashboards for logistics and fulfillment teams. My dashboards track on-time delivery, carrier performance, exceptions, and warehouse accuracy—designed for fast weekly reporting. With multi-warehouse experience, I turn complex operations data into clean visuals you can actually use.
What's included
Logistics KPI Dashboard (Google Sheets or Excel)
A complete, automated dashboard showing key logistics KPIs including on-time delivery rate, transit time trends, exception categories, warehouse accuracy, and high-level operational performance.
Weekly Performance Report Template
A clean, export-ready weekly report (PDF or Sheets) summarizing shipment delays, fulfillment issues, and operational highlights for internal team updates or stakeholder communication.
Delay & Exception Analysis Sheet
A detailed sheet categorizing delay reasons, exception types, affected regions, carrier-level issues, and operational root causes to support weekly problem-solving.
KPI Dashboard User Guide
A concise guide explaining KPI definitions, dashboard logic, color indicators, and how to update or expand the dashboard with future data.
FAQs
$300