
Interactive Power BI Dashboards with Actionable ReportPragyan Dhakal
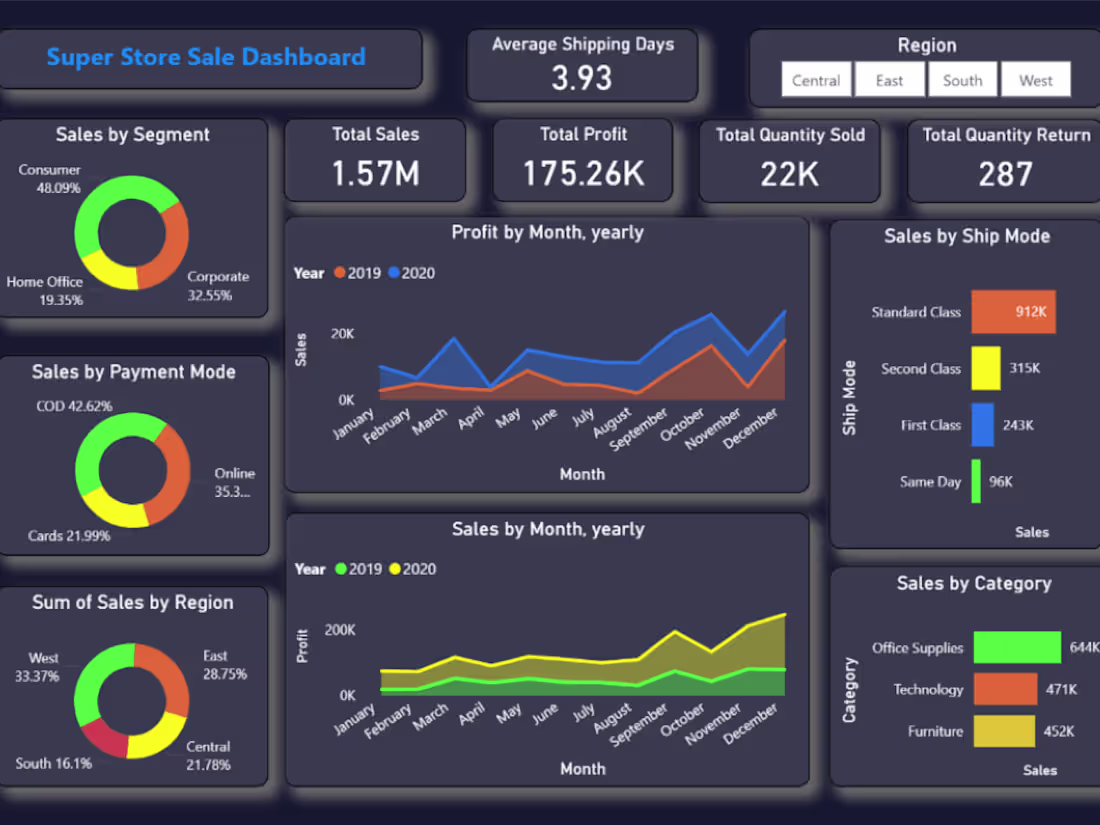
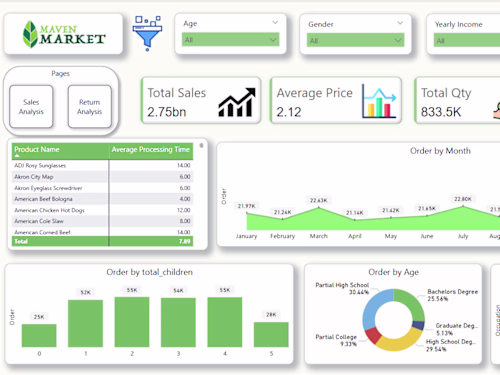
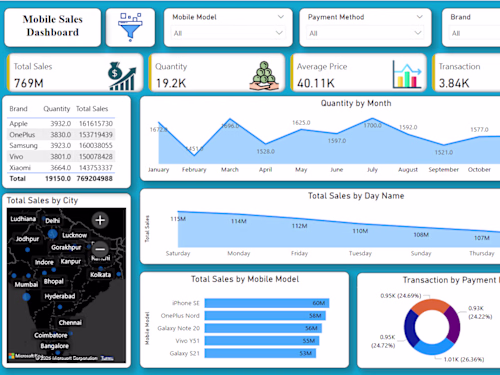
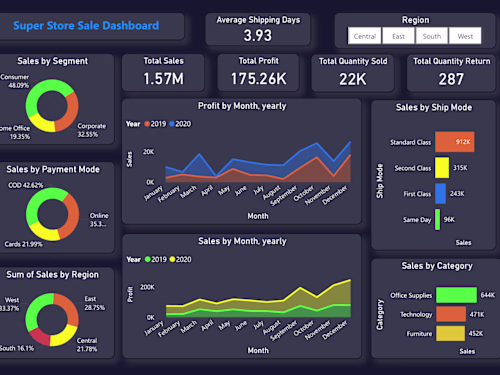
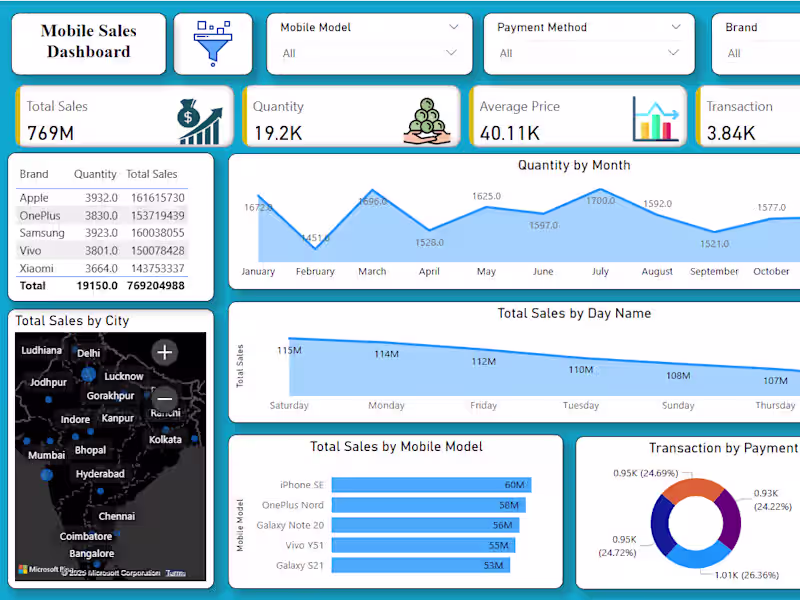
I build interactive Power BI dashboards for businesses, streamlining sales analysis, so you can spot growth opportunities instantly. Unlike templated solutions, I tailor every chart to your KPIs and train you on the spot to own your data.
What's included
Power BI Dashboard (.pbix)
Fully interactive Power BI file with dynamic filters, drill-through pages, and built-in KPIs.
Cleaned Data & Data Model
A ready-to-use, structured dataset plus the underlying data model in Power Query editor.
PDF Summary Report
Printable PDF highlighting top insights, trends, and actionable recommendations based on your KPIs.
FAQs
Example work
Pragyan's other services
Starting at$15 /hr
Tags
Microsoft Excel
Microsoft Power BI
MySQL
Python
Data Analyst
Data Modelling Analyst
Data Visualizer
Service provided by
Pragyan Dhakal Bharatpur 44200, Nepal
- 2
- Followers
Interactive Power BI Dashboards with Actionable ReportPragyan Dhakal
Starting at$15 /hr
Tags
Microsoft Excel
Microsoft Power BI
MySQL
Python
Data Analyst
Data Modelling Analyst
Data Visualizer
I build interactive Power BI dashboards for businesses, streamlining sales analysis, so you can spot growth opportunities instantly. Unlike templated solutions, I tailor every chart to your KPIs and train you on the spot to own your data.
What's included
Power BI Dashboard (.pbix)
Fully interactive Power BI file with dynamic filters, drill-through pages, and built-in KPIs.
Cleaned Data & Data Model
A ready-to-use, structured dataset plus the underlying data model in Power Query editor.
PDF Summary Report
Printable PDF highlighting top insights, trends, and actionable recommendations based on your KPIs.
FAQs
Example work
Pragyan's other services
$15 /hr