
Power BI Finance Dashboard with DAX and Power QueryRenata Lima
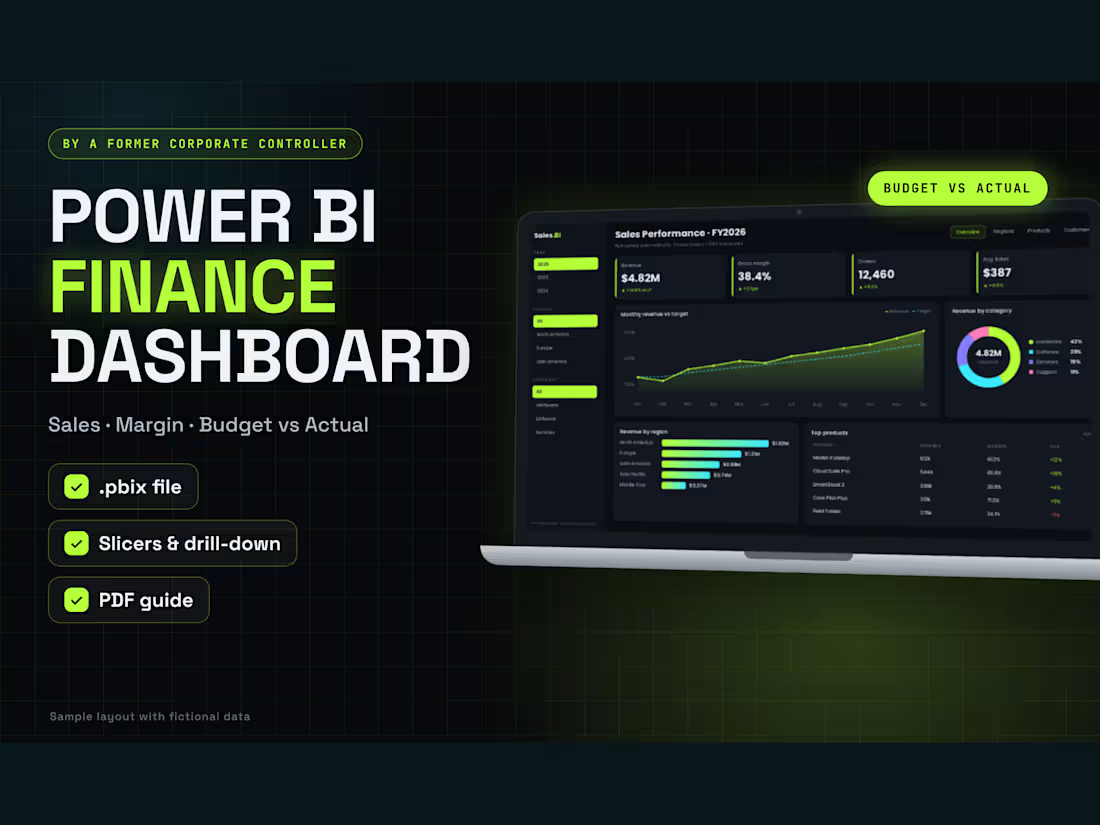
Still waiting days after month-end to see how the business did? I build Power BI dashboards that show revenue, margin, costs and budget vs actual on one screen, with slicers and drill-down.
Former corporate controller in the industrial sector. I design the report around the questions management asks.
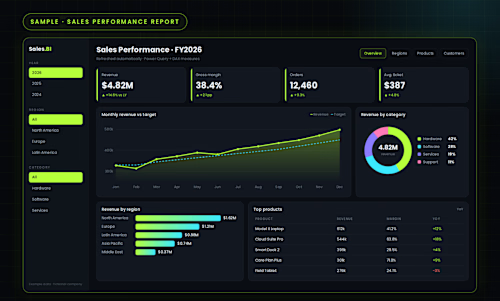
What you get. A clean data model (Power Query) and tested DAX measures; KPI cards, trends, variance vs budget and top/bottom lists; slicers by period, unit, product or cost center; an editable .pbix file plus a PDF snapshot of every page.
Starter Report, $20, 3 days. A 1-page report from 1 clean Excel or CSV source with up to 5 KPIs, 4 visuals and slicers. 2 revisions.
Finance Dashboard, $60, 4 days. Up to 3 pages and 3 sources with P&L or sales KPIs, budget vs actual and DAX measures. 3 revisions.
Management Reporting, $150, 6 days. Up to 5 pages and 6 sources with a data model, drill-down, budget vs actual and cash views. 5 revisions.
Every order includes a short PDF guide to refresh your data, and measures are checked against your source totals. Anonymized sample data welcome. Power BI Desktop (free) is enough; publishing to the Power BI Service needs your own license. Communication in writing, here on Contra.

Starting at$20
Duration3 days
Tags
DAX
Microsoft Power BI

Data Analyst
Data Visualizer
Financial Analyst
Budget vs Actual
Service provided by
Renata Lima State of Mato Grosso, Brazil
Power BI Finance Dashboard with DAX and Power QueryRenata Lima
Starting at$20
Duration3 days
Tags
DAX
Microsoft Power BI
Data Analyst
Data Visualizer
Financial Analyst
Budget vs Actual
Still waiting days after month-end to see how the business did? I build Power BI dashboards that show revenue, margin, costs and budget vs actual on one screen, with slicers and drill-down.
Former corporate controller in the industrial sector. I design the report around the questions management asks.
What you get. A clean data model (Power Query) and tested DAX measures; KPI cards, trends, variance vs budget and top/bottom lists; slicers by period, unit, product or cost center; an editable .pbix file plus a PDF snapshot of every page.
Starter Report, $20, 3 days. A 1-page report from 1 clean Excel or CSV source with up to 5 KPIs, 4 visuals and slicers. 2 revisions.
Finance Dashboard, $60, 4 days. Up to 3 pages and 3 sources with P&L or sales KPIs, budget vs actual and DAX measures. 3 revisions.
Management Reporting, $150, 6 days. Up to 5 pages and 6 sources with a data model, drill-down, budget vs actual and cash views. 5 revisions.
Every order includes a short PDF guide to refresh your data, and measures are checked against your source totals. Anonymized sample data welcome. Power BI Desktop (free) is enough; publishing to the Power BI Service needs your own license. Communication in writing, here on Contra.
$20