
Know in five minutes a month whether your business is on track.
Track your 12 most important numbers each month: a macro-free .xlsx intended for Excel, Google Sheets or LibreOffice. UK-ready, about 15 minutes to set up.
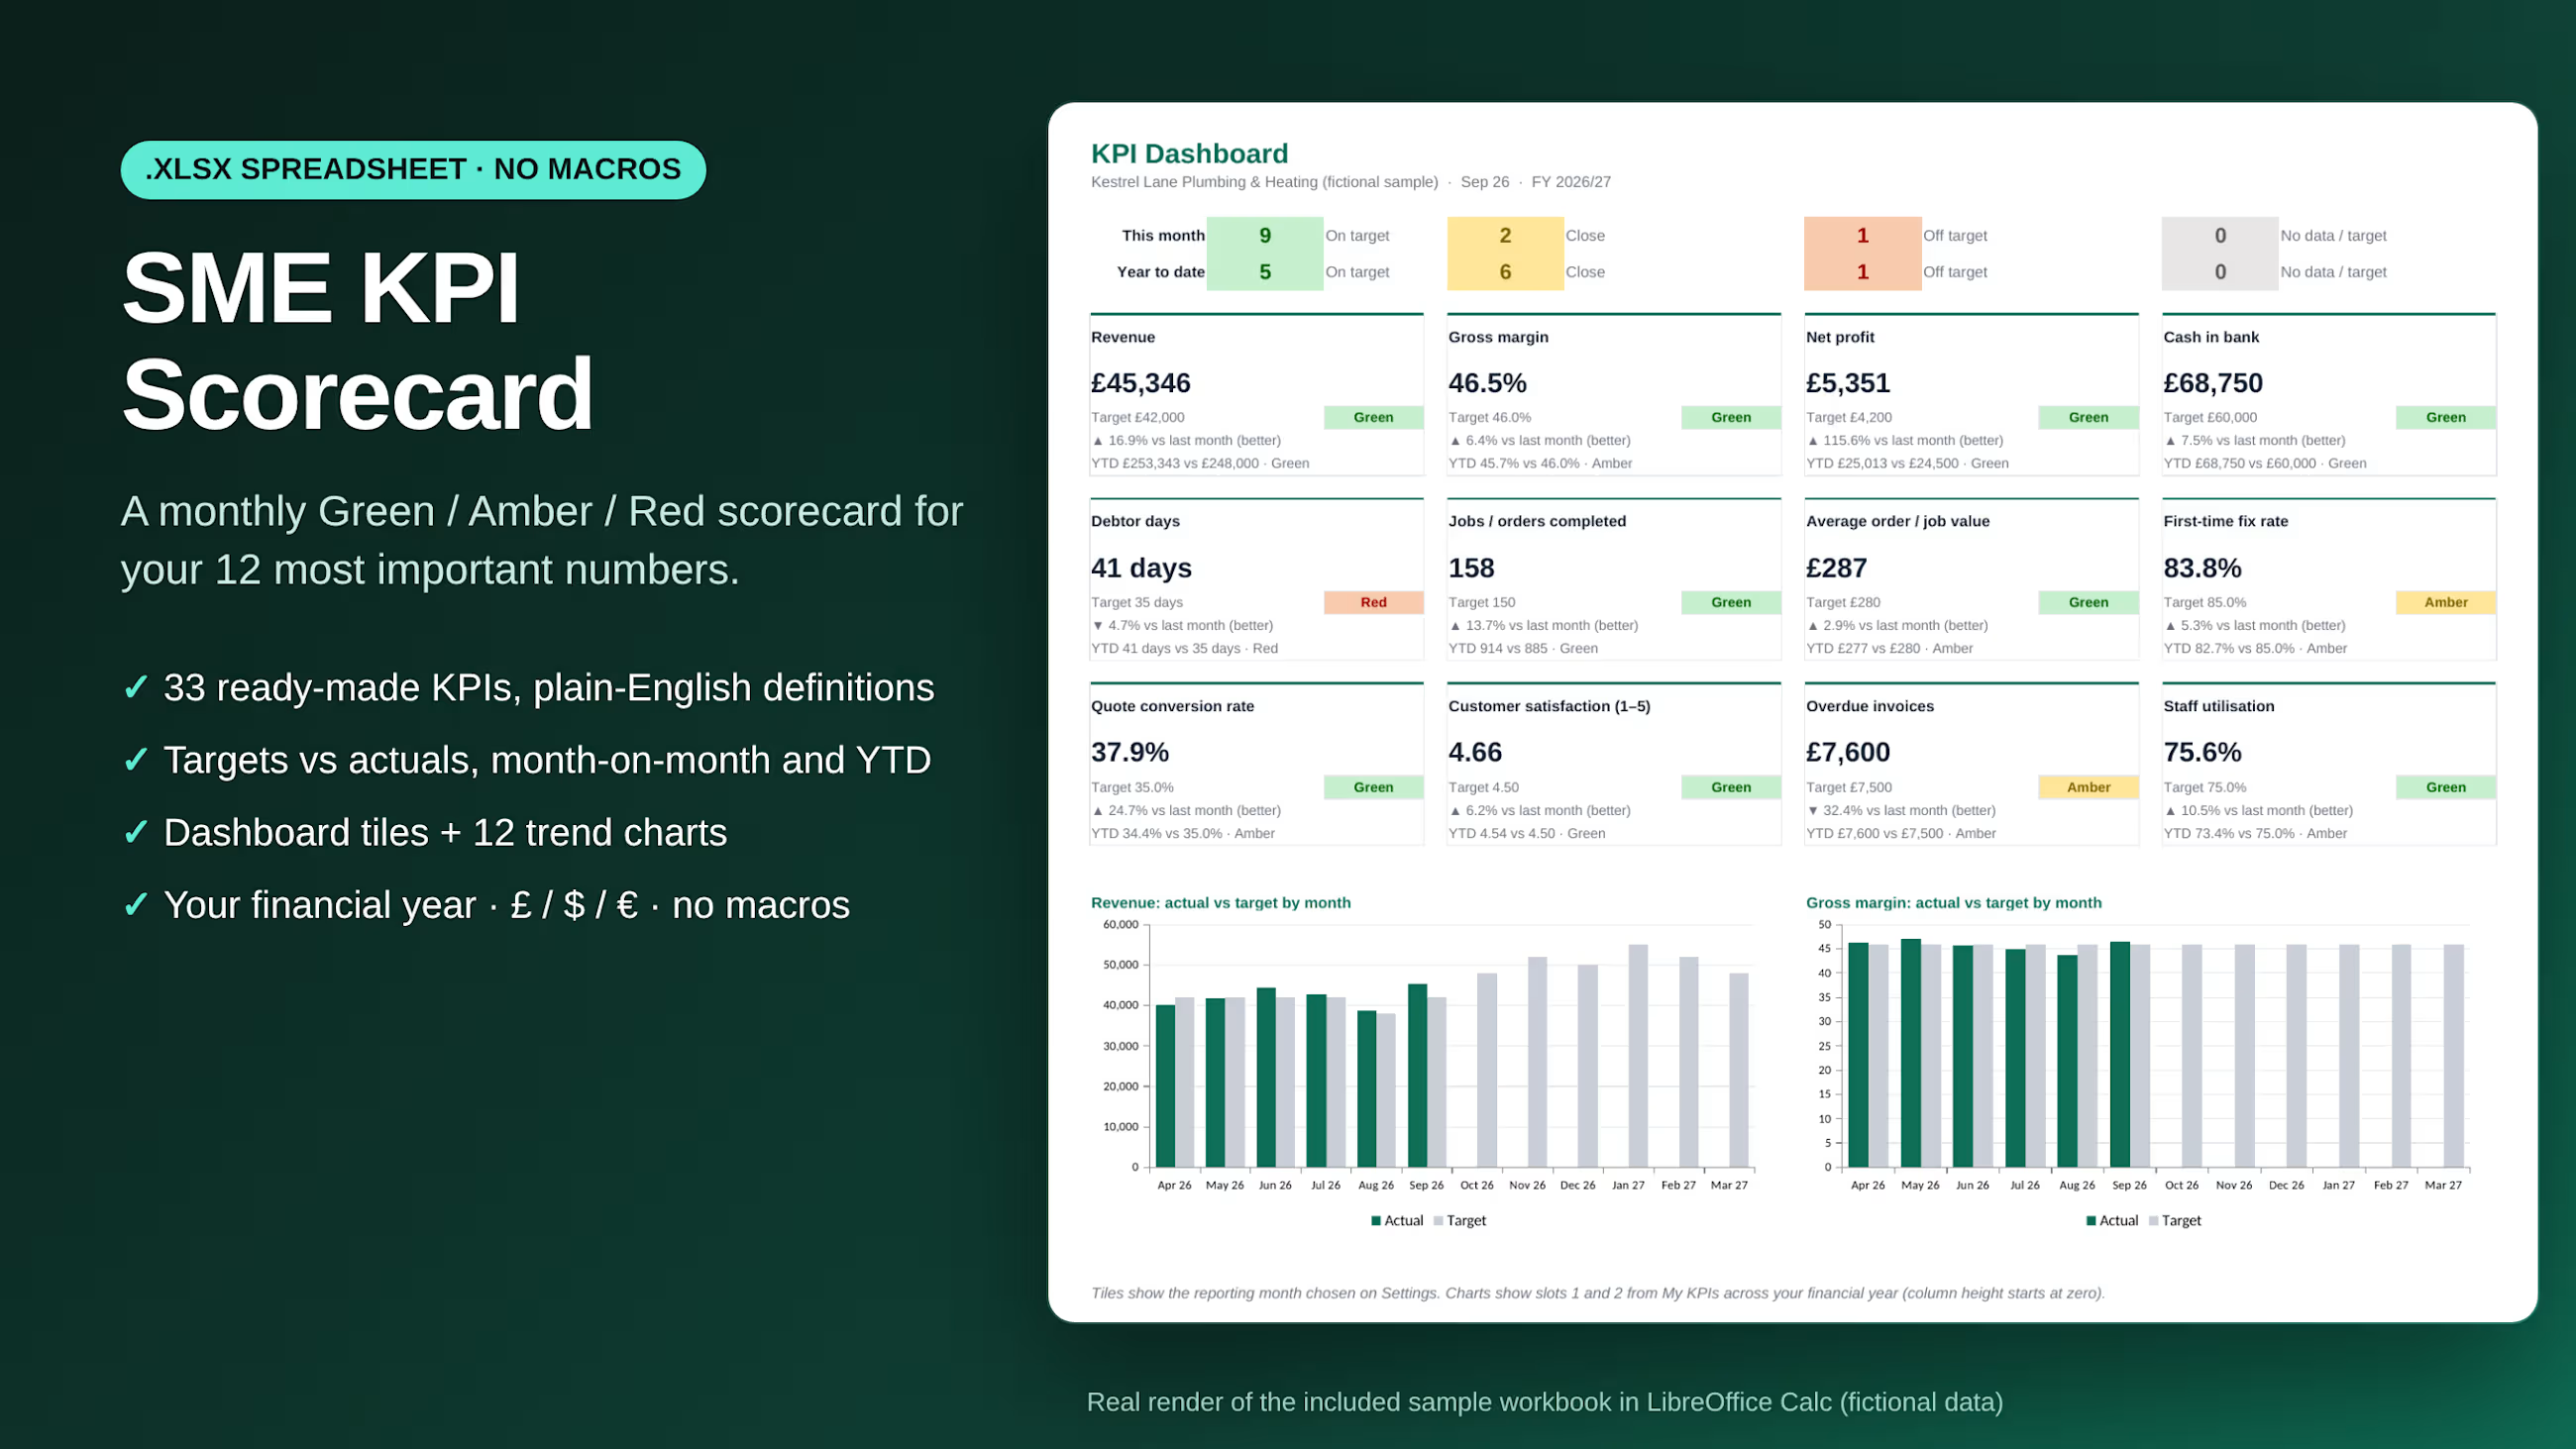
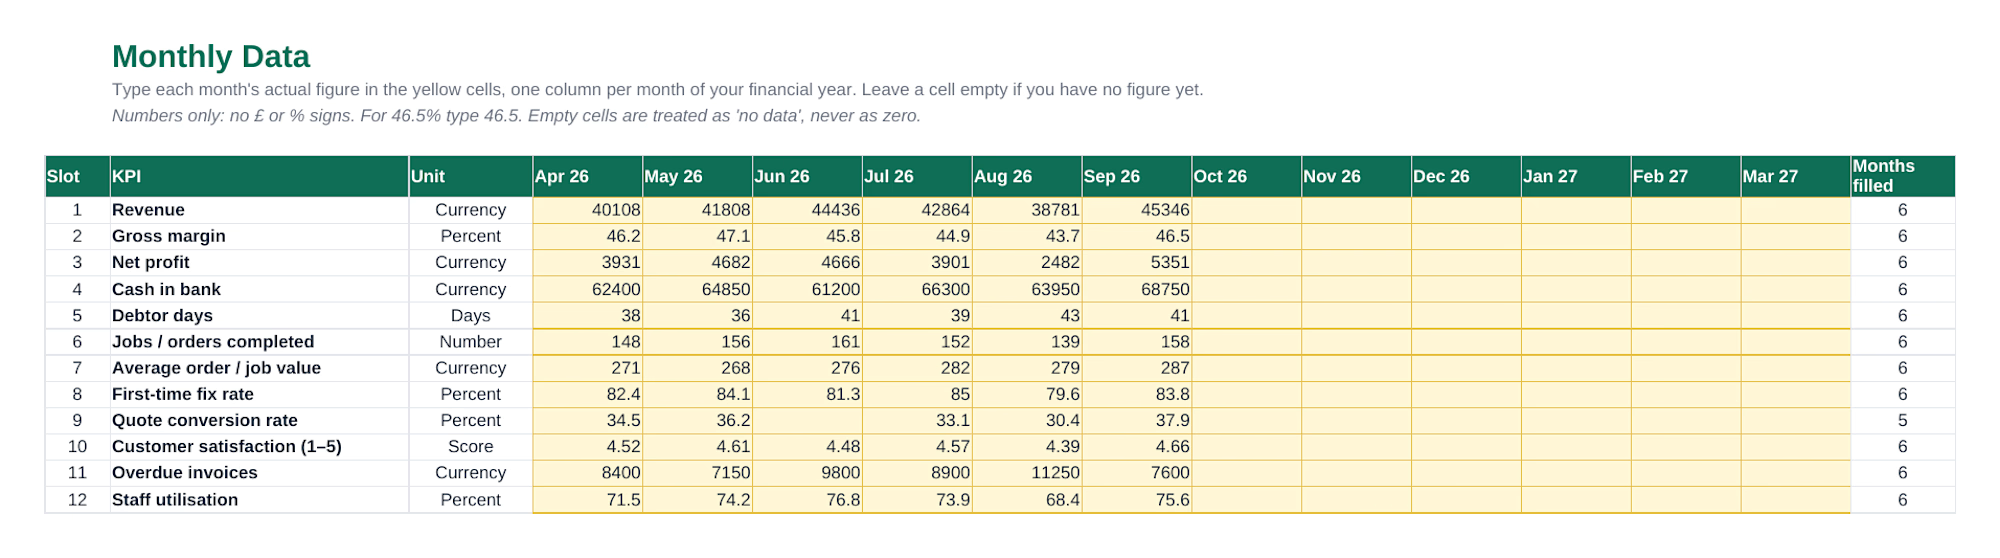
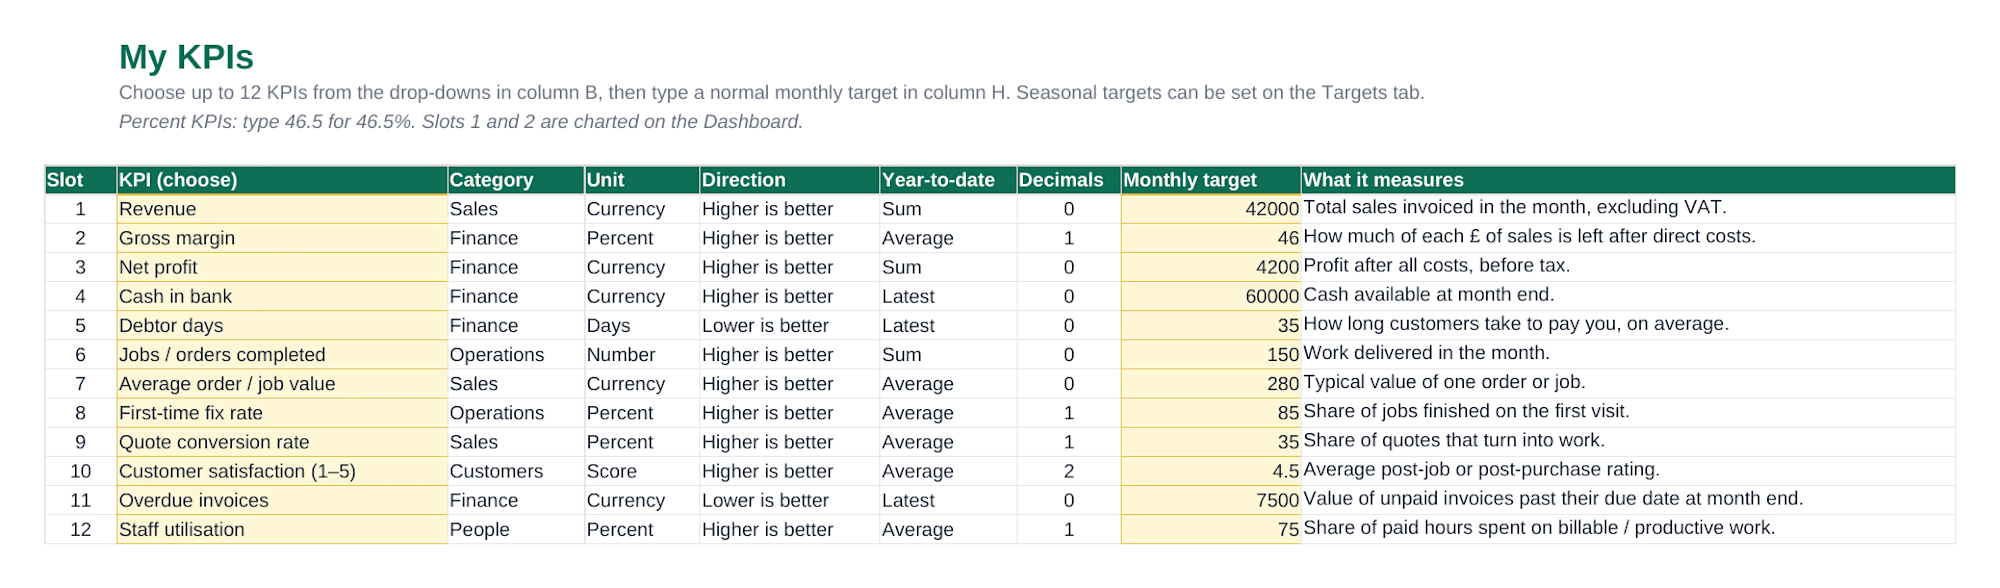
SME KPI Scorecard is a ready-made spreadsheet for small-business owners. Pick up to 12 KPIs from a library of 33 (revenue, gross margin, cash in bank, debtor days, first-time fix rate, quote conversion and more), set a monthly target for each, then type in each month's figures. The workbook does the rest:
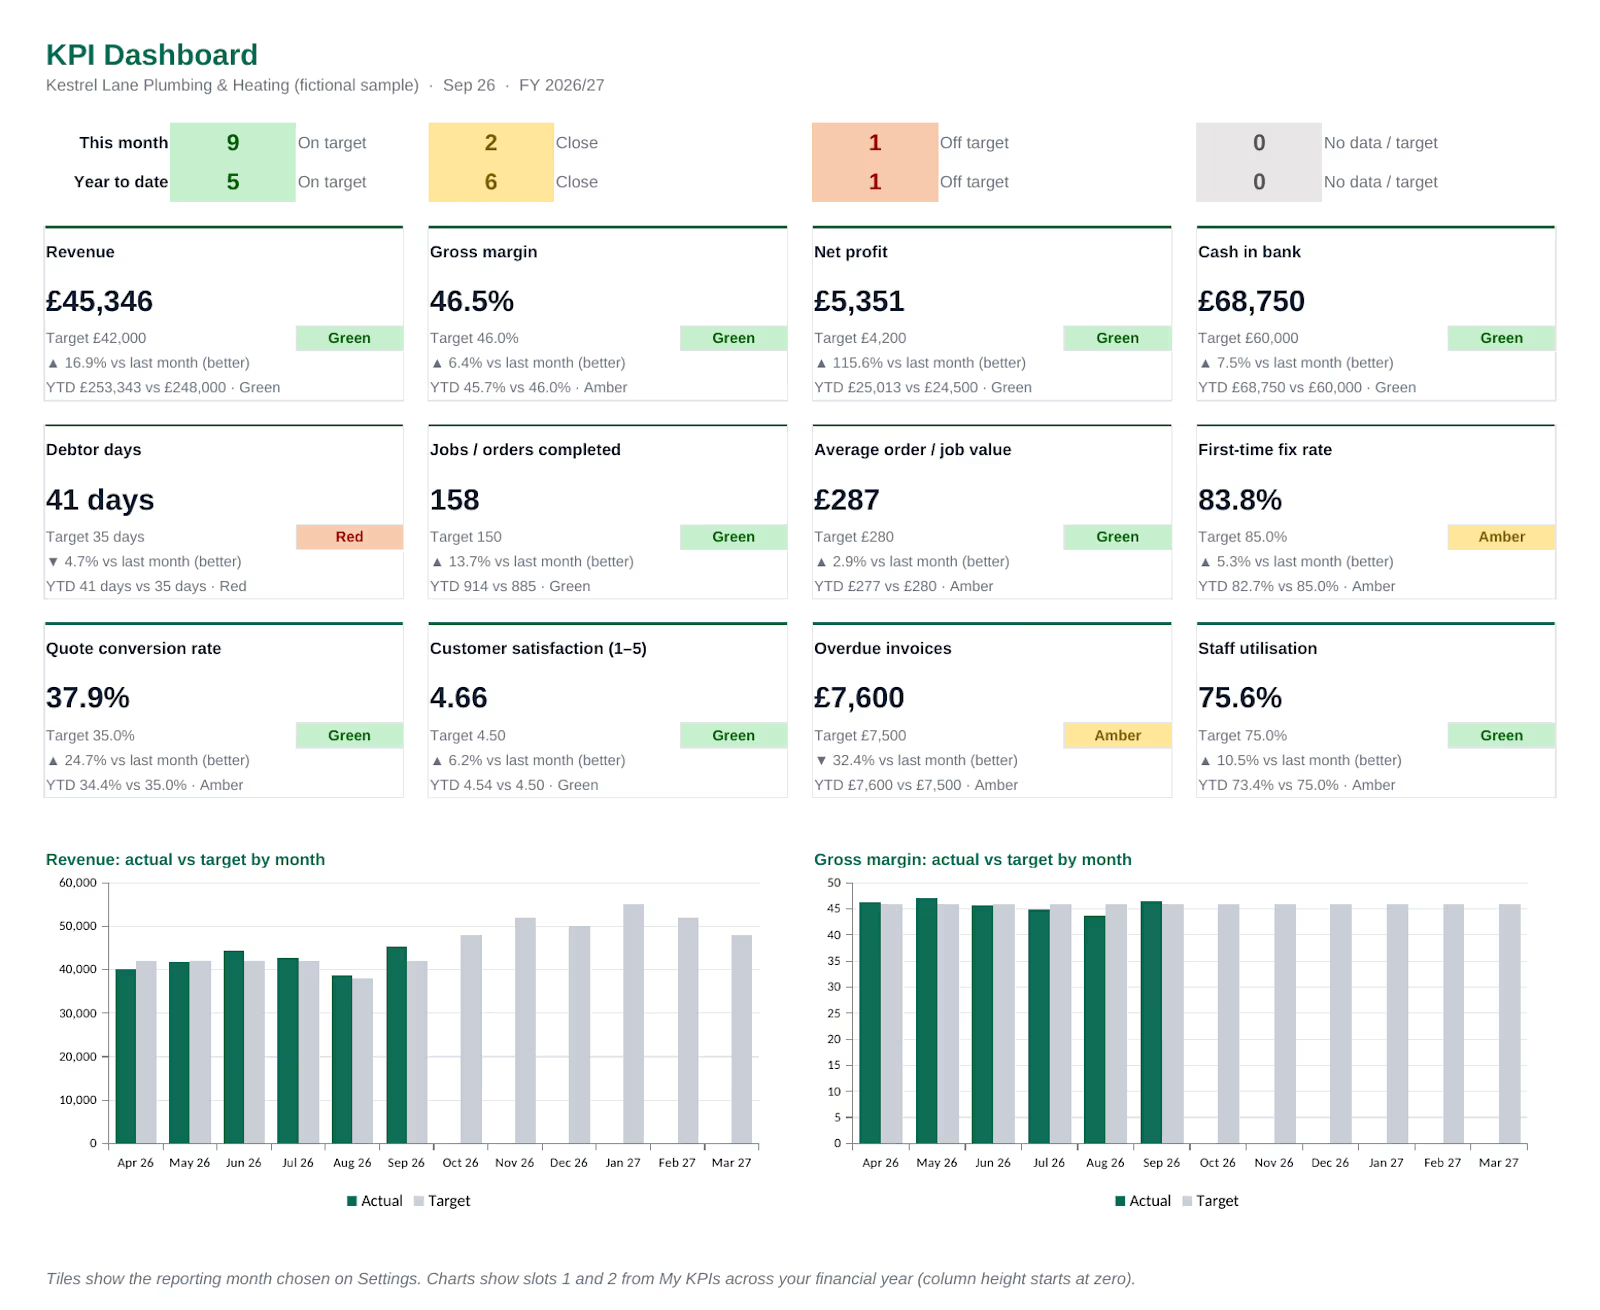
a Dashboard with 12 tiles: this month's figure, target, Green / Amber / Red status, change since last month (marked better or worse) and year to date
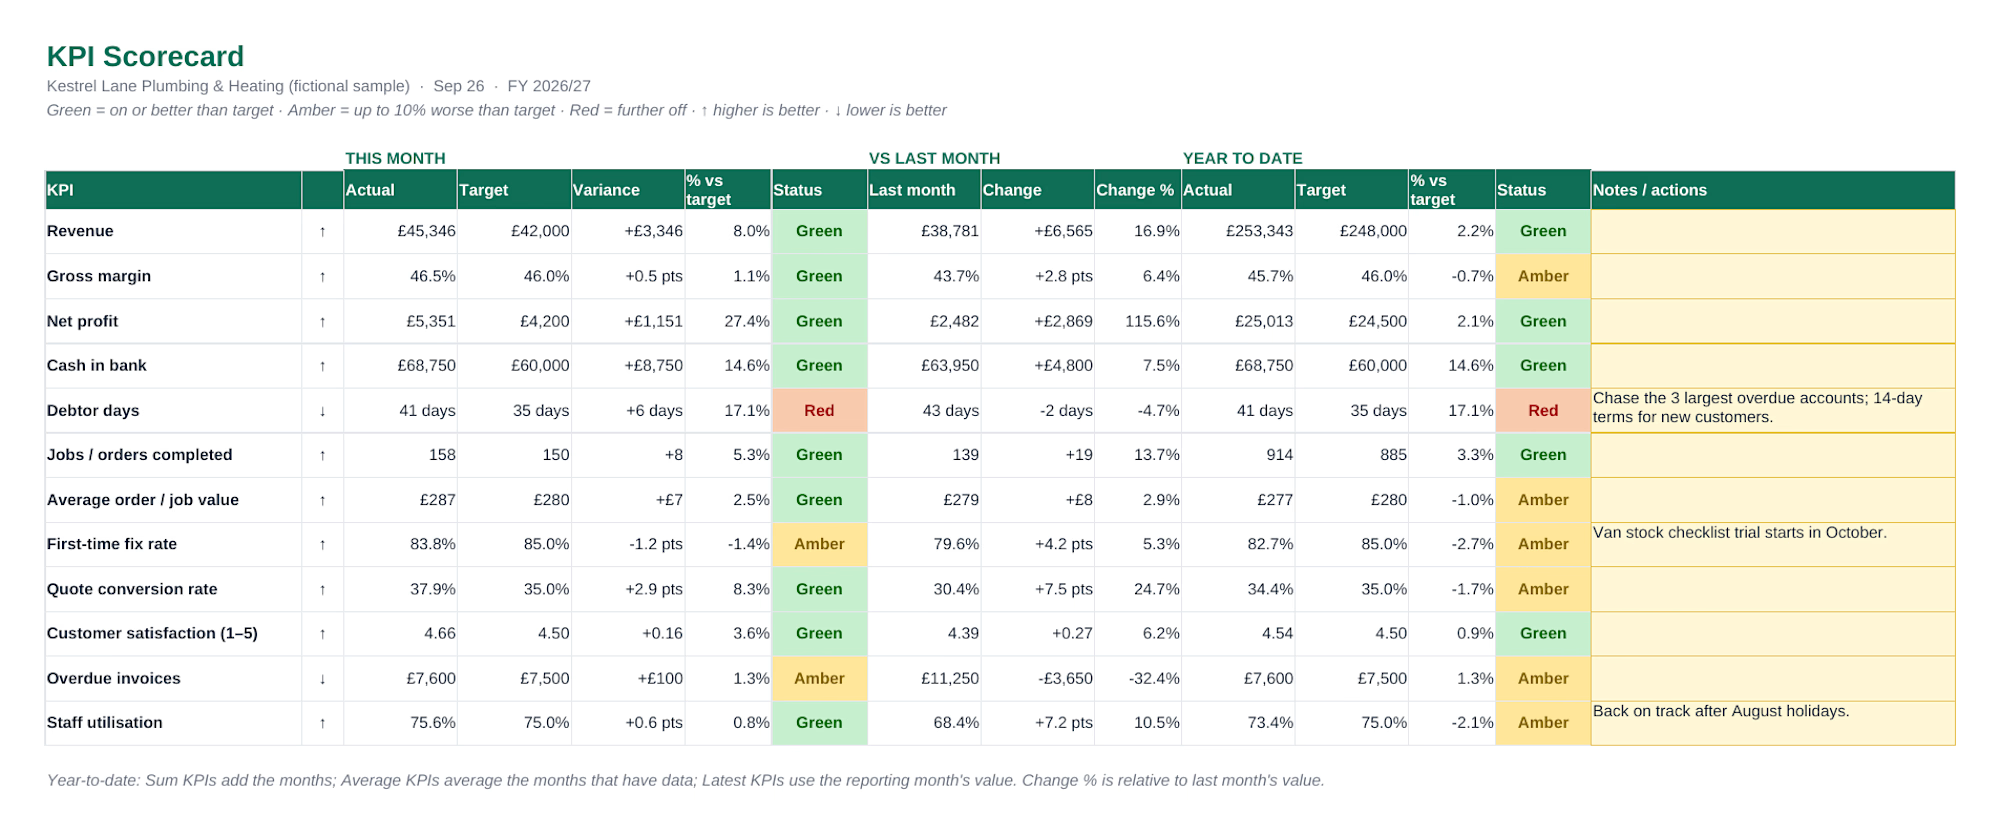
a Scorecard table with variances, % vs target, month-on-month and year-to-date figures, plus a Notes / actions column for your monthly review
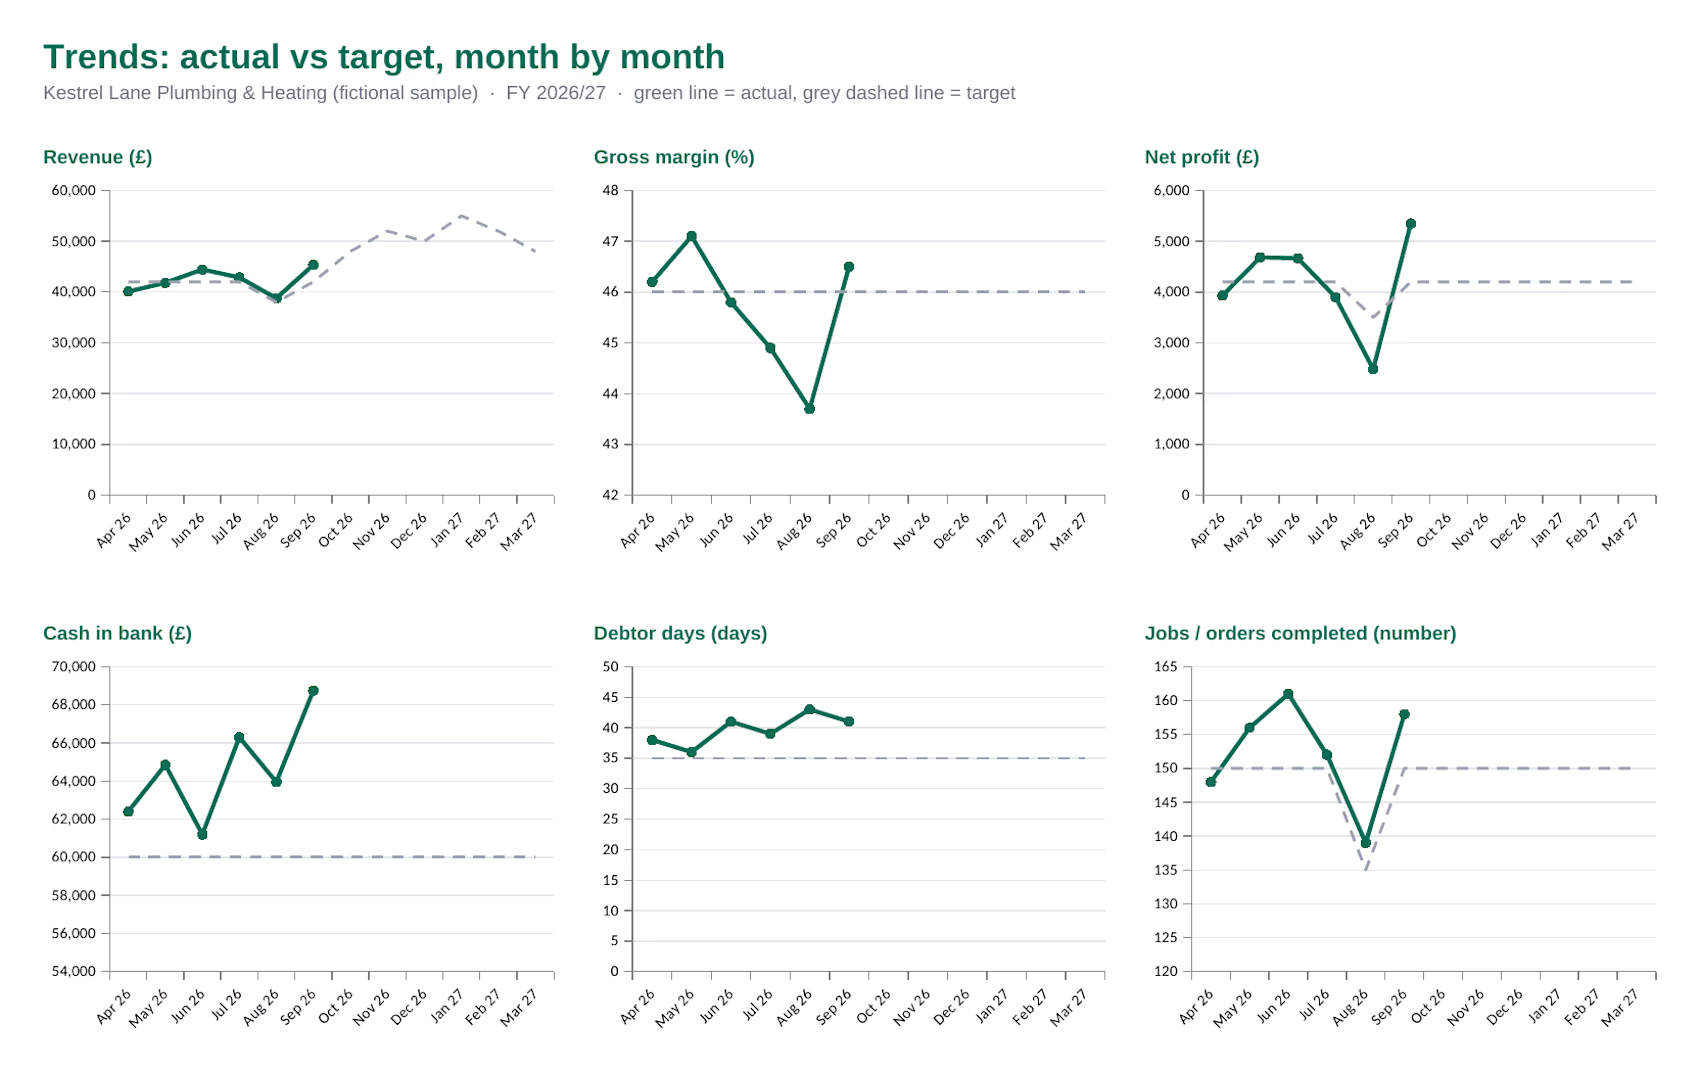
Trends: 12 charts of actual vs target across your financial year
It follows your financial year (e.g. April–March), shows £, $ or €, and understands that for some KPIs lower is better (debtor days, overdue invoices, overheads). Every KPI in the library comes with a plain-English definition and how to calculate it, so you're never guessing what "debtor days" means.
You get a blank workbook to use and a sample filled in for a fictional plumbing & heating firm, so you can see a finished scorecard before you start.
Benefits
A monthly review in 5 minutes. Type a column of numbers, pick the month, read the colours.
33 ready-made KPIs with definitions. Choose from drop-downs instead of inventing metrics, or add your own.
Targets that respect the seasons. A normal monthly target, plus optional month-by-month overrides.
Month-on-month and year to date. YTD sums, averages or takes the latest figure, depending on the KPI.
Honest colours. Green = on target, Amber = within your tolerance (10% by default), Red = further off. "Lower is better" KPIs are handled correctly.
One .xlsx, no macros. No add-ins and no connections. Intended for Excel 2010+, Google Sheets and LibreOffice; uses only classic spreadsheet functions. Automated checks ran in LibreOffice; the sample was opened by the maker in a desktop spreadsheet app (see Requirements).
Print-ready. Dashboard, Scorecard and Trends are set up for A4 landscape PDFs to share with partners, lenders or your accountant.
What's included
SME-KPI-Scorecard-BLANK.xlsx: your scorecard, with 12 starter KPIs pre-selected (change any)
SME-KPI-Scorecard-SAMPLE.xlsx: the same workbook with six months of fictional sample data
SETUP-GUIDE.pdf + SETUP.md: step-by-step setup for the intended apps (Excel, Google Sheets, LibreOffice; about 15 minutes)
LICENSE.txt: single-business commercial licence
Workbook tabs: Start Here · Settings · My KPIs · Monthly Data · Targets · Dashboard · Scorecard · Trends · KPI Library · Calc (helper)
Requirements
A spreadsheet app that opens .xlsx. Intended for Microsoft Excel 2010 or later (Windows/Mac/365), Google Sheets (free Google account), or LibreOffice Calc (free). Automated checks: LibreOffice Calc 25.2 (127/127). The sample workbook was opened and checked by the maker in a desktop spreadsheet app (a quick check — Excel and Google Sheets are not claimed as tested by name). Apple Numbers isn't supported.
What it doesn't do
No automatic data import. You type or paste monthly figures. It doesn't connect to Xero, QuickBooks, Sage, Shopify or your bank, and doesn't auto-refresh.
No multi-user features or cloud sync of its own. For team access, use Google Sheets' or Microsoft 365's own sharing.
12 KPIs and one financial year per file. Start a new copy each year. There's no prior-year comparison.
Monthly only. No weekly or daily tracking.
One Amber tolerance for all KPIs.
Not accounting software or financial advice. It compares the figures you enter with the targets you set.
Testing so far: every formula recalculated and checked automatically in LibreOffice Calc 25.2, with zero formula errors in both files. Built only from classic functions available in Excel 2010+, Google Sheets and LibreOffice. The sample workbook was opened and checked by the maker in a desktop spreadsheet app (a quick check, not a full test of every feature). Excel and Google Sheets remain intended targets and are not claimed as tested by name. Charts may look slightly different across apps.
Screenshots are shown in LibreOffice Calc.
FAQ
Does it work in Google Sheets?
Google Sheets is an intended target: upload the .xlsx to Google Drive, open it and choose File → Save as Google Sheets. It uses only classic functions Sheets supports, and no macros. Automated checks ran in LibreOffice; the sample was opened by the maker in a desktop spreadsheet app (not claimed as Google Sheets by name). If anything misbehaves, message me and I'll fix it.
Excel on Mac or Windows?
Excel 2010 or later (including Microsoft 365) is an intended target. There are no macros, so there's nothing to enable apart from Excel's normal "Enable Editing" bar on downloaded files. Automated checks ran in LibreOffice; the sample was opened by the maker in a desktop spreadsheet app (not claimed as Excel by name).
Do I need to know formulas?
No. You type into yellow cells and choose from drop-downs. Everything else is calculated.
Can I add my own KPIs?
Yes. There are 7 blank rows at the bottom of the KPI Library. Add a name, unit, direction and how year to date should work, and it appears in the drop-downs.
My financial year starts in April. Is that OK?
Yes. Choose any start month. Columns, year to date and charts follow your year.
Can it pull figures from Xero / QuickBooks automatically?
No. You type or paste the monthly figures in. That's deliberate, so it stays simple and works anywhere. If you want something connected to your exports, see the Offline KPI Dashboard or the custom service below.
Can my accountant or business partner see it?
Yes. Share PDFs freely, share a filled-in copy with your accountant or adviser, or use Google Sheets' own sharing within your business. The licence covers one business.
Can I get it set up for me?
Yes. As a separate fixed-price service I build a hosted dashboard around your exports, with a shared-password login and up to 6 charts or tables, for $399 in 5 business days: https://contra.com/s/b3ONZrkl-spreadsheet-to-live-ops-dashboard-in-5-days-csv-excel-sheets. The scorecard is complete on its own, and most small businesses won't need this.
Prefer exploring raw exports as a dashboard? See the Offline KPI Dashboard: https://contra.com/products/BZbVwE8j-offline-kpi-dashboard-turn-any-csv-into-a-private-dashboard
Built with AI assistance, tested with automated checks in LibreOffice, and the sample workbook was opened and checked by the maker in a desktop spreadsheet app before release.
Get it for$24.00
Tags
Google Sheets
Microsoft Excel

Business Owner
Templates
Analytics
Product created by
Chris Elder proLondon, UK
Chris's other products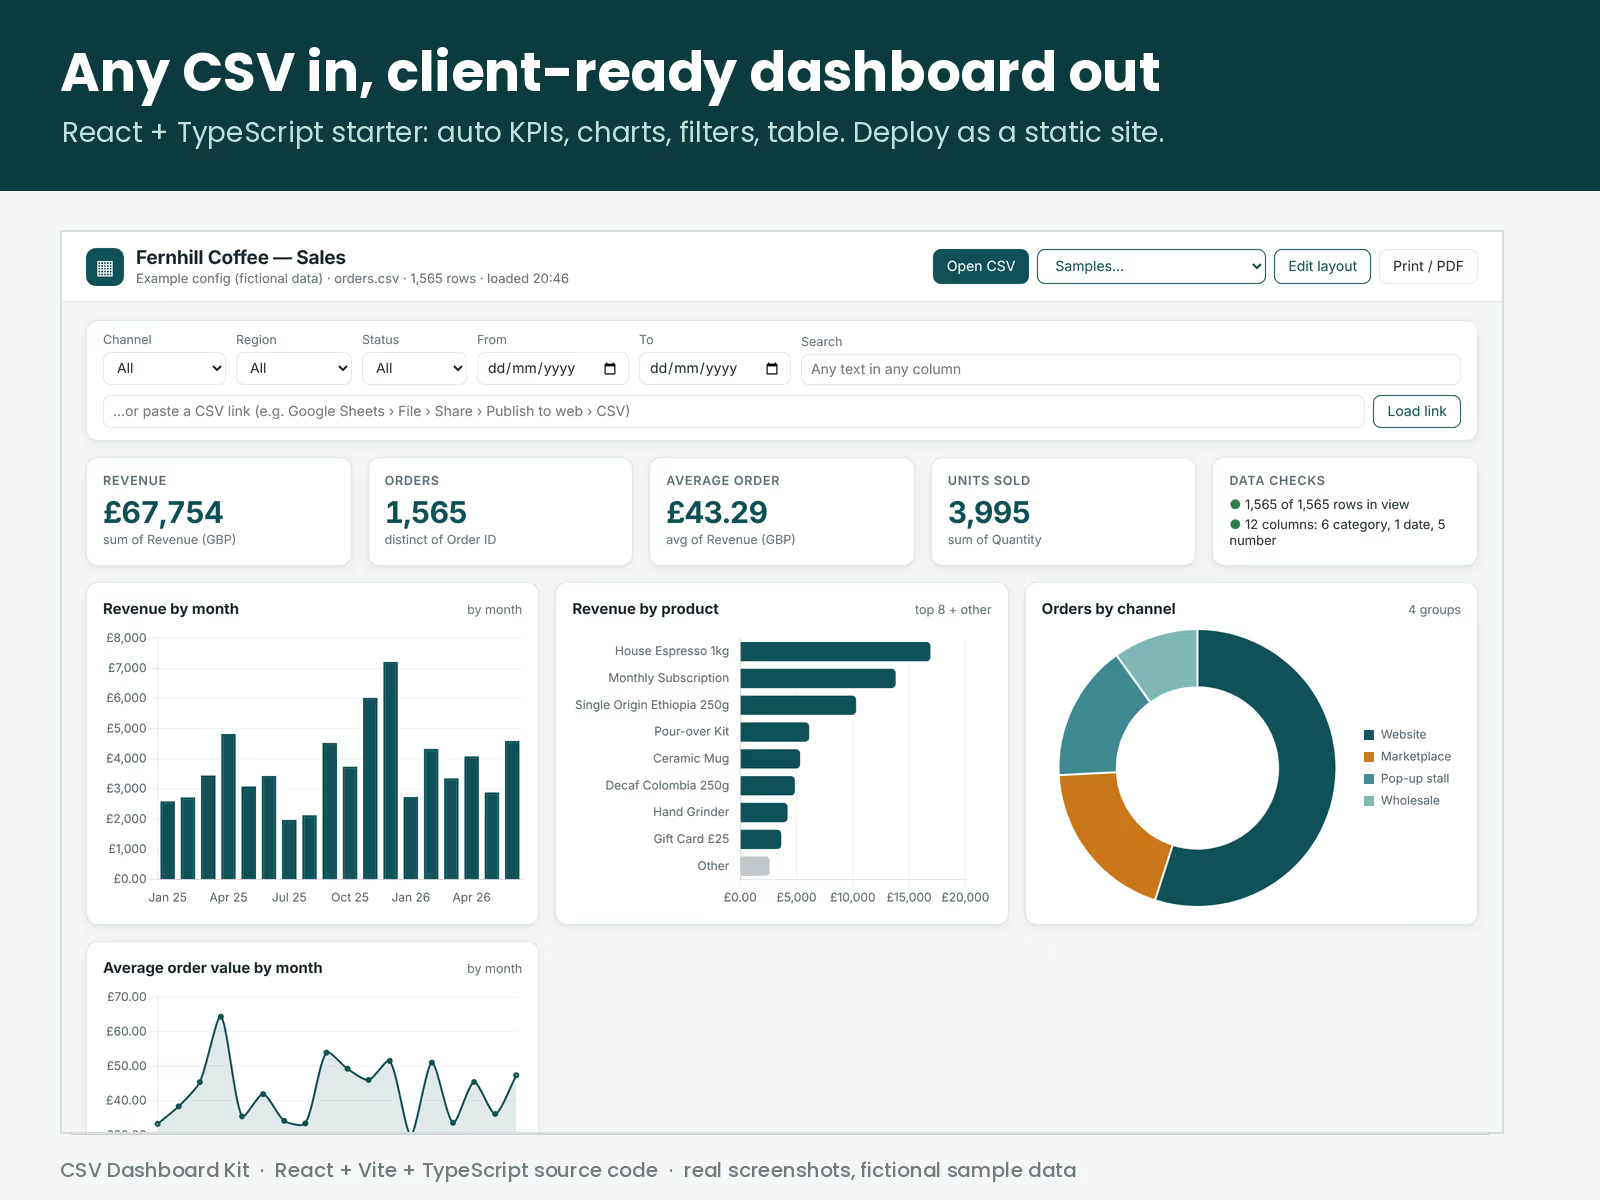
CSV Dashboard Kit – React + TS source
$49.00
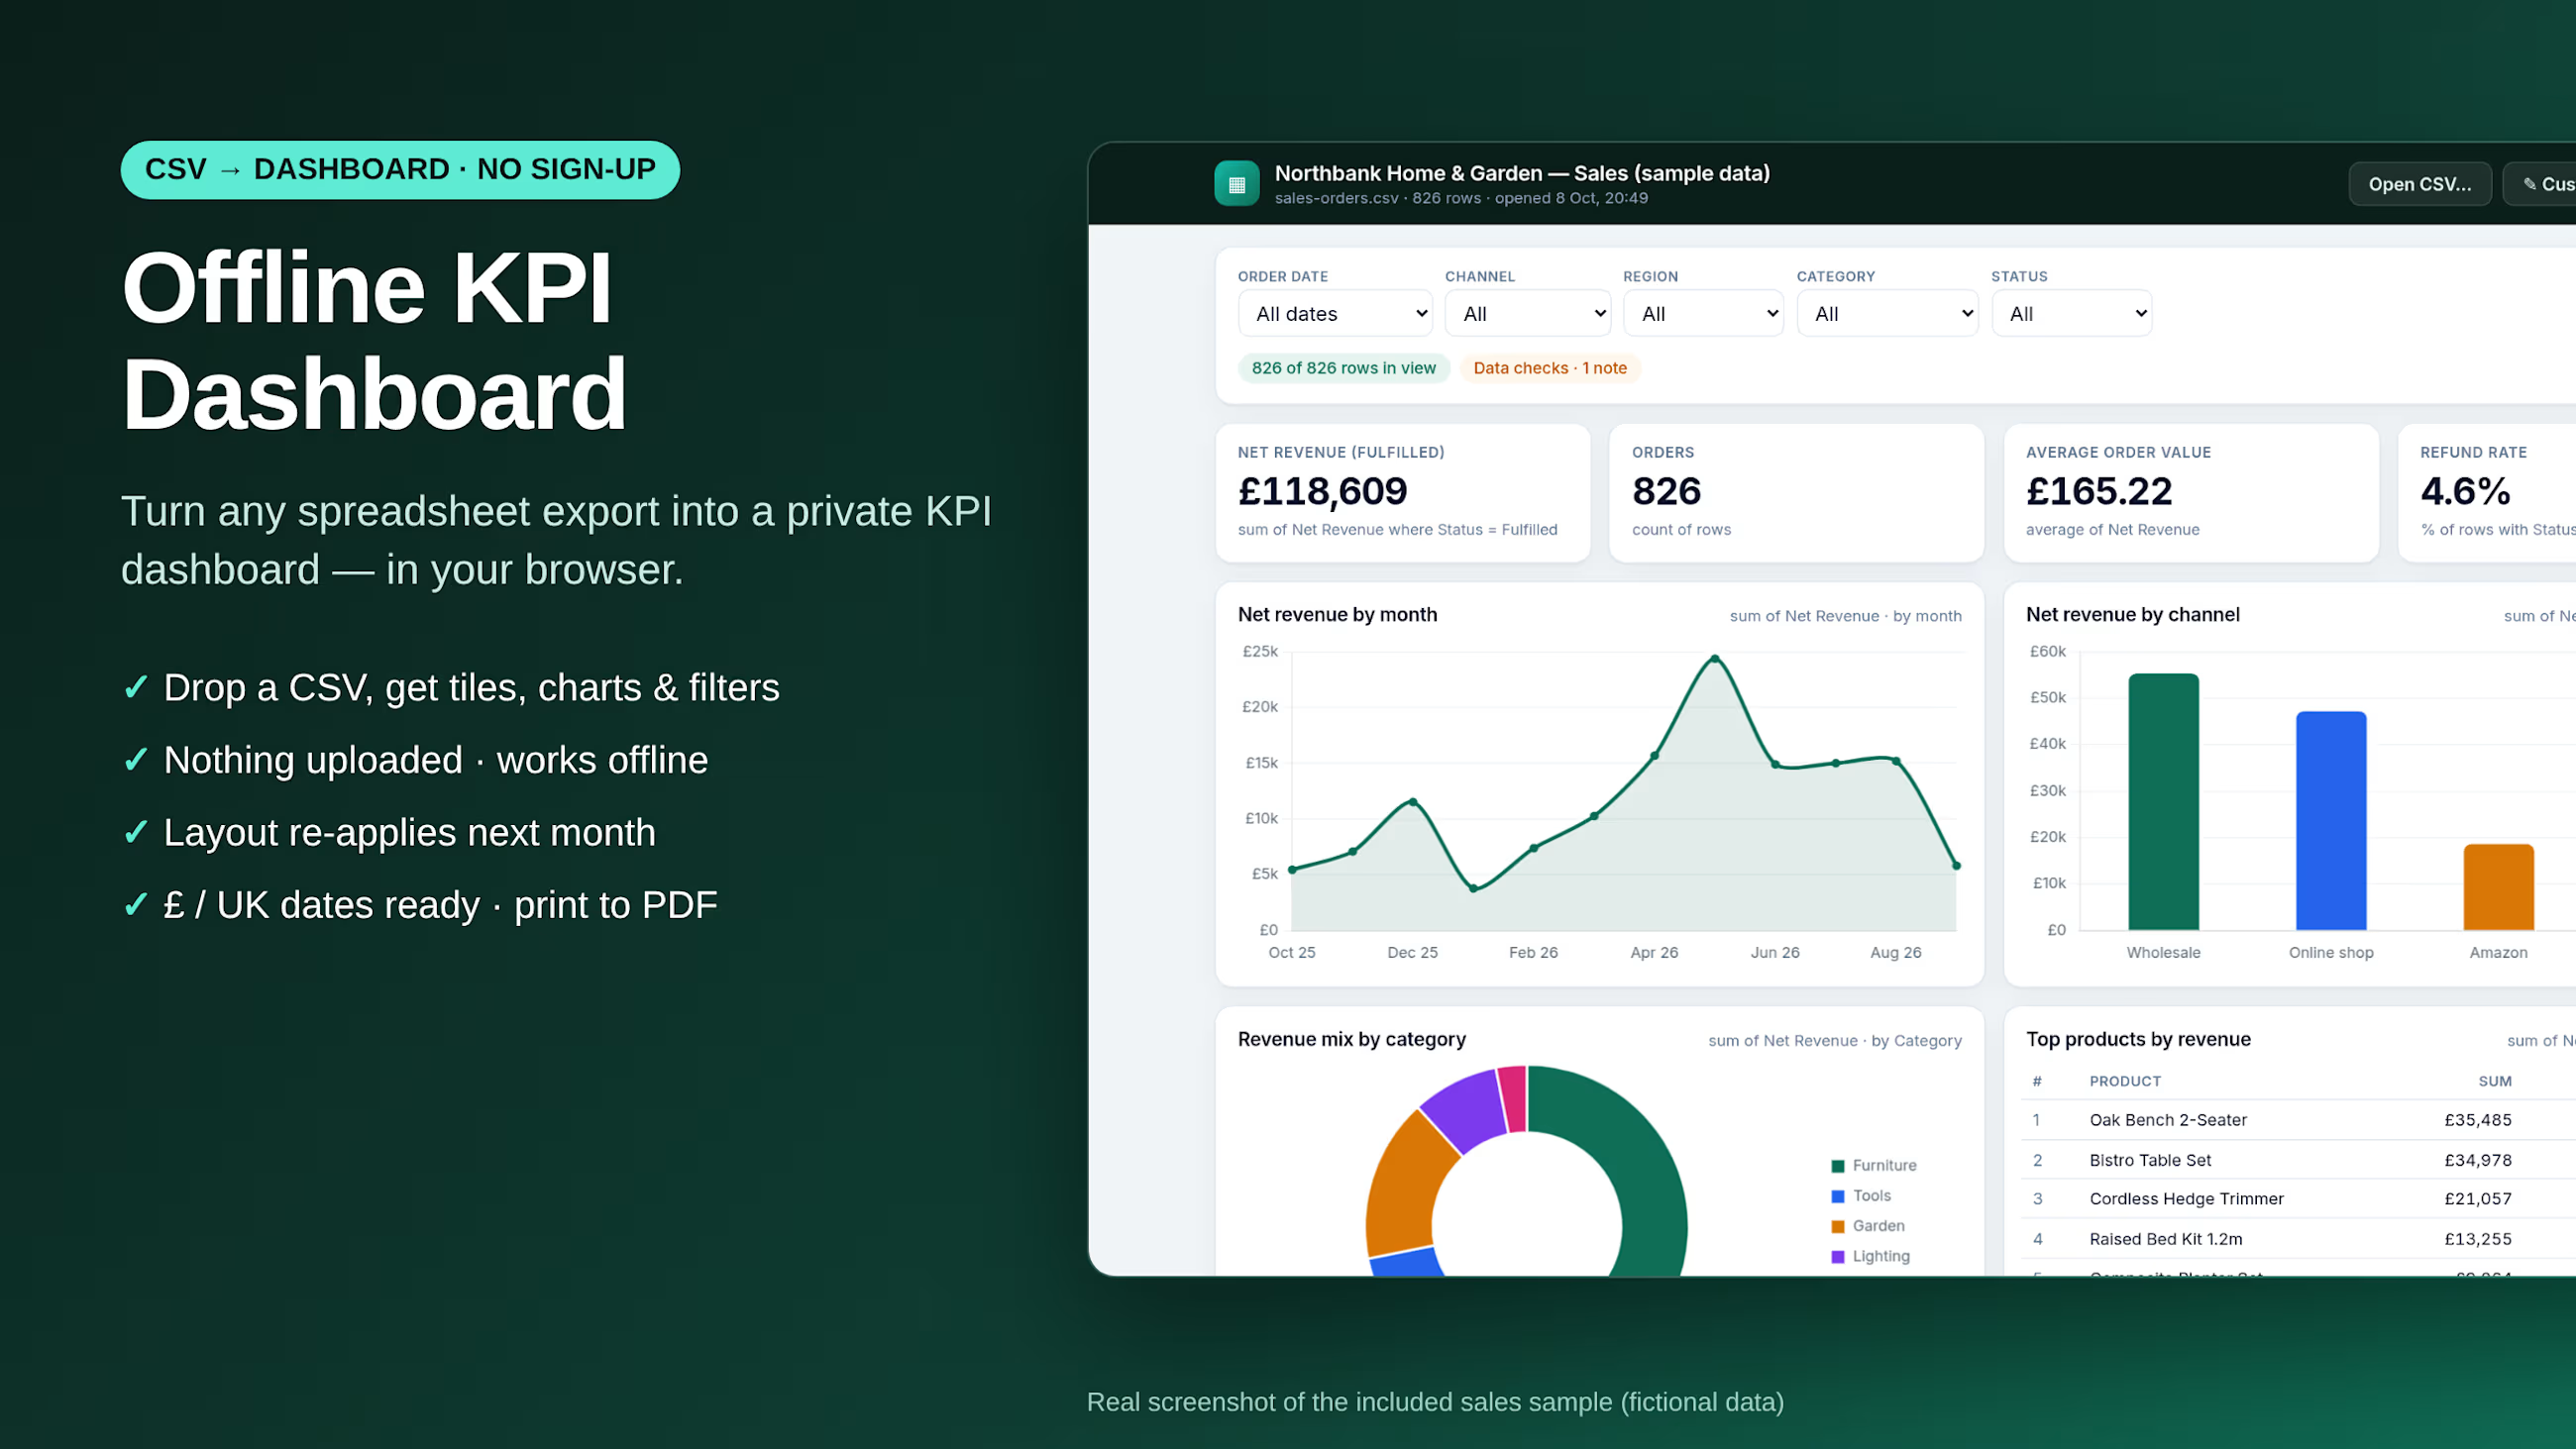
Offline KPI Dashboard – Turn Any CSV into a Private Dashboard
$29.00
Get it for$24.00
Tags
Google Sheets
Microsoft Excel
Business Owner
Templates
Analytics
Know in five minutes a month whether your business is on track.
Track your 12 most important numbers each month: a macro-free .xlsx intended for Excel, Google Sheets or LibreOffice. UK-ready, about 15 minutes to set up.
SME KPI Scorecard is a ready-made spreadsheet for small-business owners. Pick up to 12 KPIs from a library of 33 (revenue, gross margin, cash in bank, debtor days, first-time fix rate, quote conversion and more), set a monthly target for each, then type in each month's figures. The workbook does the rest:
a Dashboard with 12 tiles: this month's figure, target, Green / Amber / Red status, change since last month (marked better or worse) and year to date
a Scorecard table with variances, % vs target, month-on-month and year-to-date figures, plus a Notes / actions column for your monthly review
Trends: 12 charts of actual vs target across your financial year
It follows your financial year (e.g. April–March), shows £, $ or €, and understands that for some KPIs lower is better (debtor days, overdue invoices, overheads). Every KPI in the library comes with a plain-English definition and how to calculate it, so you're never guessing what "debtor days" means.
You get a blank workbook to use and a sample filled in for a fictional plumbing & heating firm, so you can see a finished scorecard before you start.
Benefits
A monthly review in 5 minutes. Type a column of numbers, pick the month, read the colours.
33 ready-made KPIs with definitions. Choose from drop-downs instead of inventing metrics, or add your own.
Targets that respect the seasons. A normal monthly target, plus optional month-by-month overrides.
Month-on-month and year to date. YTD sums, averages or takes the latest figure, depending on the KPI.
Honest colours. Green = on target, Amber = within your tolerance (10% by default), Red = further off. "Lower is better" KPIs are handled correctly.
One .xlsx, no macros. No add-ins and no connections. Intended for Excel 2010+, Google Sheets and LibreOffice; uses only classic spreadsheet functions. Automated checks ran in LibreOffice; the sample was opened by the maker in a desktop spreadsheet app (see Requirements).
Print-ready. Dashboard, Scorecard and Trends are set up for A4 landscape PDFs to share with partners, lenders or your accountant.
What's included
SME-KPI-Scorecard-BLANK.xlsx: your scorecard, with 12 starter KPIs pre-selected (change any)
SME-KPI-Scorecard-SAMPLE.xlsx: the same workbook with six months of fictional sample data
SETUP-GUIDE.pdf + SETUP.md: step-by-step setup for the intended apps (Excel, Google Sheets, LibreOffice; about 15 minutes)
LICENSE.txt: single-business commercial licence
Workbook tabs: Start Here · Settings · My KPIs · Monthly Data · Targets · Dashboard · Scorecard · Trends · KPI Library · Calc (helper)
Requirements
A spreadsheet app that opens .xlsx. Intended for Microsoft Excel 2010 or later (Windows/Mac/365), Google Sheets (free Google account), or LibreOffice Calc (free). Automated checks: LibreOffice Calc 25.2 (127/127). The sample workbook was opened and checked by the maker in a desktop spreadsheet app (a quick check — Excel and Google Sheets are not claimed as tested by name). Apple Numbers isn't supported.
What it doesn't do
No automatic data import. You type or paste monthly figures. It doesn't connect to Xero, QuickBooks, Sage, Shopify or your bank, and doesn't auto-refresh.
No multi-user features or cloud sync of its own. For team access, use Google Sheets' or Microsoft 365's own sharing.
12 KPIs and one financial year per file. Start a new copy each year. There's no prior-year comparison.
Monthly only. No weekly or daily tracking.
One Amber tolerance for all KPIs.
Not accounting software or financial advice. It compares the figures you enter with the targets you set.
Testing so far: every formula recalculated and checked automatically in LibreOffice Calc 25.2, with zero formula errors in both files. Built only from classic functions available in Excel 2010+, Google Sheets and LibreOffice. The sample workbook was opened and checked by the maker in a desktop spreadsheet app (a quick check, not a full test of every feature). Excel and Google Sheets remain intended targets and are not claimed as tested by name. Charts may look slightly different across apps.
Screenshots are shown in LibreOffice Calc.
FAQ
Does it work in Google Sheets?
Google Sheets is an intended target: upload the .xlsx to Google Drive, open it and choose File → Save as Google Sheets. It uses only classic functions Sheets supports, and no macros. Automated checks ran in LibreOffice; the sample was opened by the maker in a desktop spreadsheet app (not claimed as Google Sheets by name). If anything misbehaves, message me and I'll fix it.
Excel on Mac or Windows?
Excel 2010 or later (including Microsoft 365) is an intended target. There are no macros, so there's nothing to enable apart from Excel's normal "Enable Editing" bar on downloaded files. Automated checks ran in LibreOffice; the sample was opened by the maker in a desktop spreadsheet app (not claimed as Excel by name).
Do I need to know formulas?
No. You type into yellow cells and choose from drop-downs. Everything else is calculated.
Can I add my own KPIs?
Yes. There are 7 blank rows at the bottom of the KPI Library. Add a name, unit, direction and how year to date should work, and it appears in the drop-downs.
My financial year starts in April. Is that OK?
Yes. Choose any start month. Columns, year to date and charts follow your year.
Can it pull figures from Xero / QuickBooks automatically?
No. You type or paste the monthly figures in. That's deliberate, so it stays simple and works anywhere. If you want something connected to your exports, see the Offline KPI Dashboard or the custom service below.
Can my accountant or business partner see it?
Yes. Share PDFs freely, share a filled-in copy with your accountant or adviser, or use Google Sheets' own sharing within your business. The licence covers one business.
Can I get it set up for me?
Yes. As a separate fixed-price service I build a hosted dashboard around your exports, with a shared-password login and up to 6 charts or tables, for $399 in 5 business days: https://contra.com/s/b3ONZrkl-spreadsheet-to-live-ops-dashboard-in-5-days-csv-excel-sheets. The scorecard is complete on its own, and most small businesses won't need this.
Prefer exploring raw exports as a dashboard? See the Offline KPI Dashboard: https://contra.com/products/BZbVwE8j-offline-kpi-dashboard-turn-any-csv-into-a-private-dashboard
Built with AI assistance, tested with automated checks in LibreOffice, and the sample workbook was opened and checked by the maker in a desktop spreadsheet app before release.
Chris's other products
CSV Dashboard Kit – React + TS source
$49.00
Offline KPI Dashboard – Turn Any CSV into a Private Dashboard
$29.00
$24.00