
Drop in a CSV from your shop, accounting, booking or helpdesk system and get tiles, charts and filters in seconds — in your browser, with nothing uploaded and no sign-up.
You already have the data. Your shop, till, accounting package, booking tool or helpdesk will export it as a CSV. The problem is what happens next: another evening of pivot tables, or another monthly subscription for a dashboard tool that wants your data on its servers.
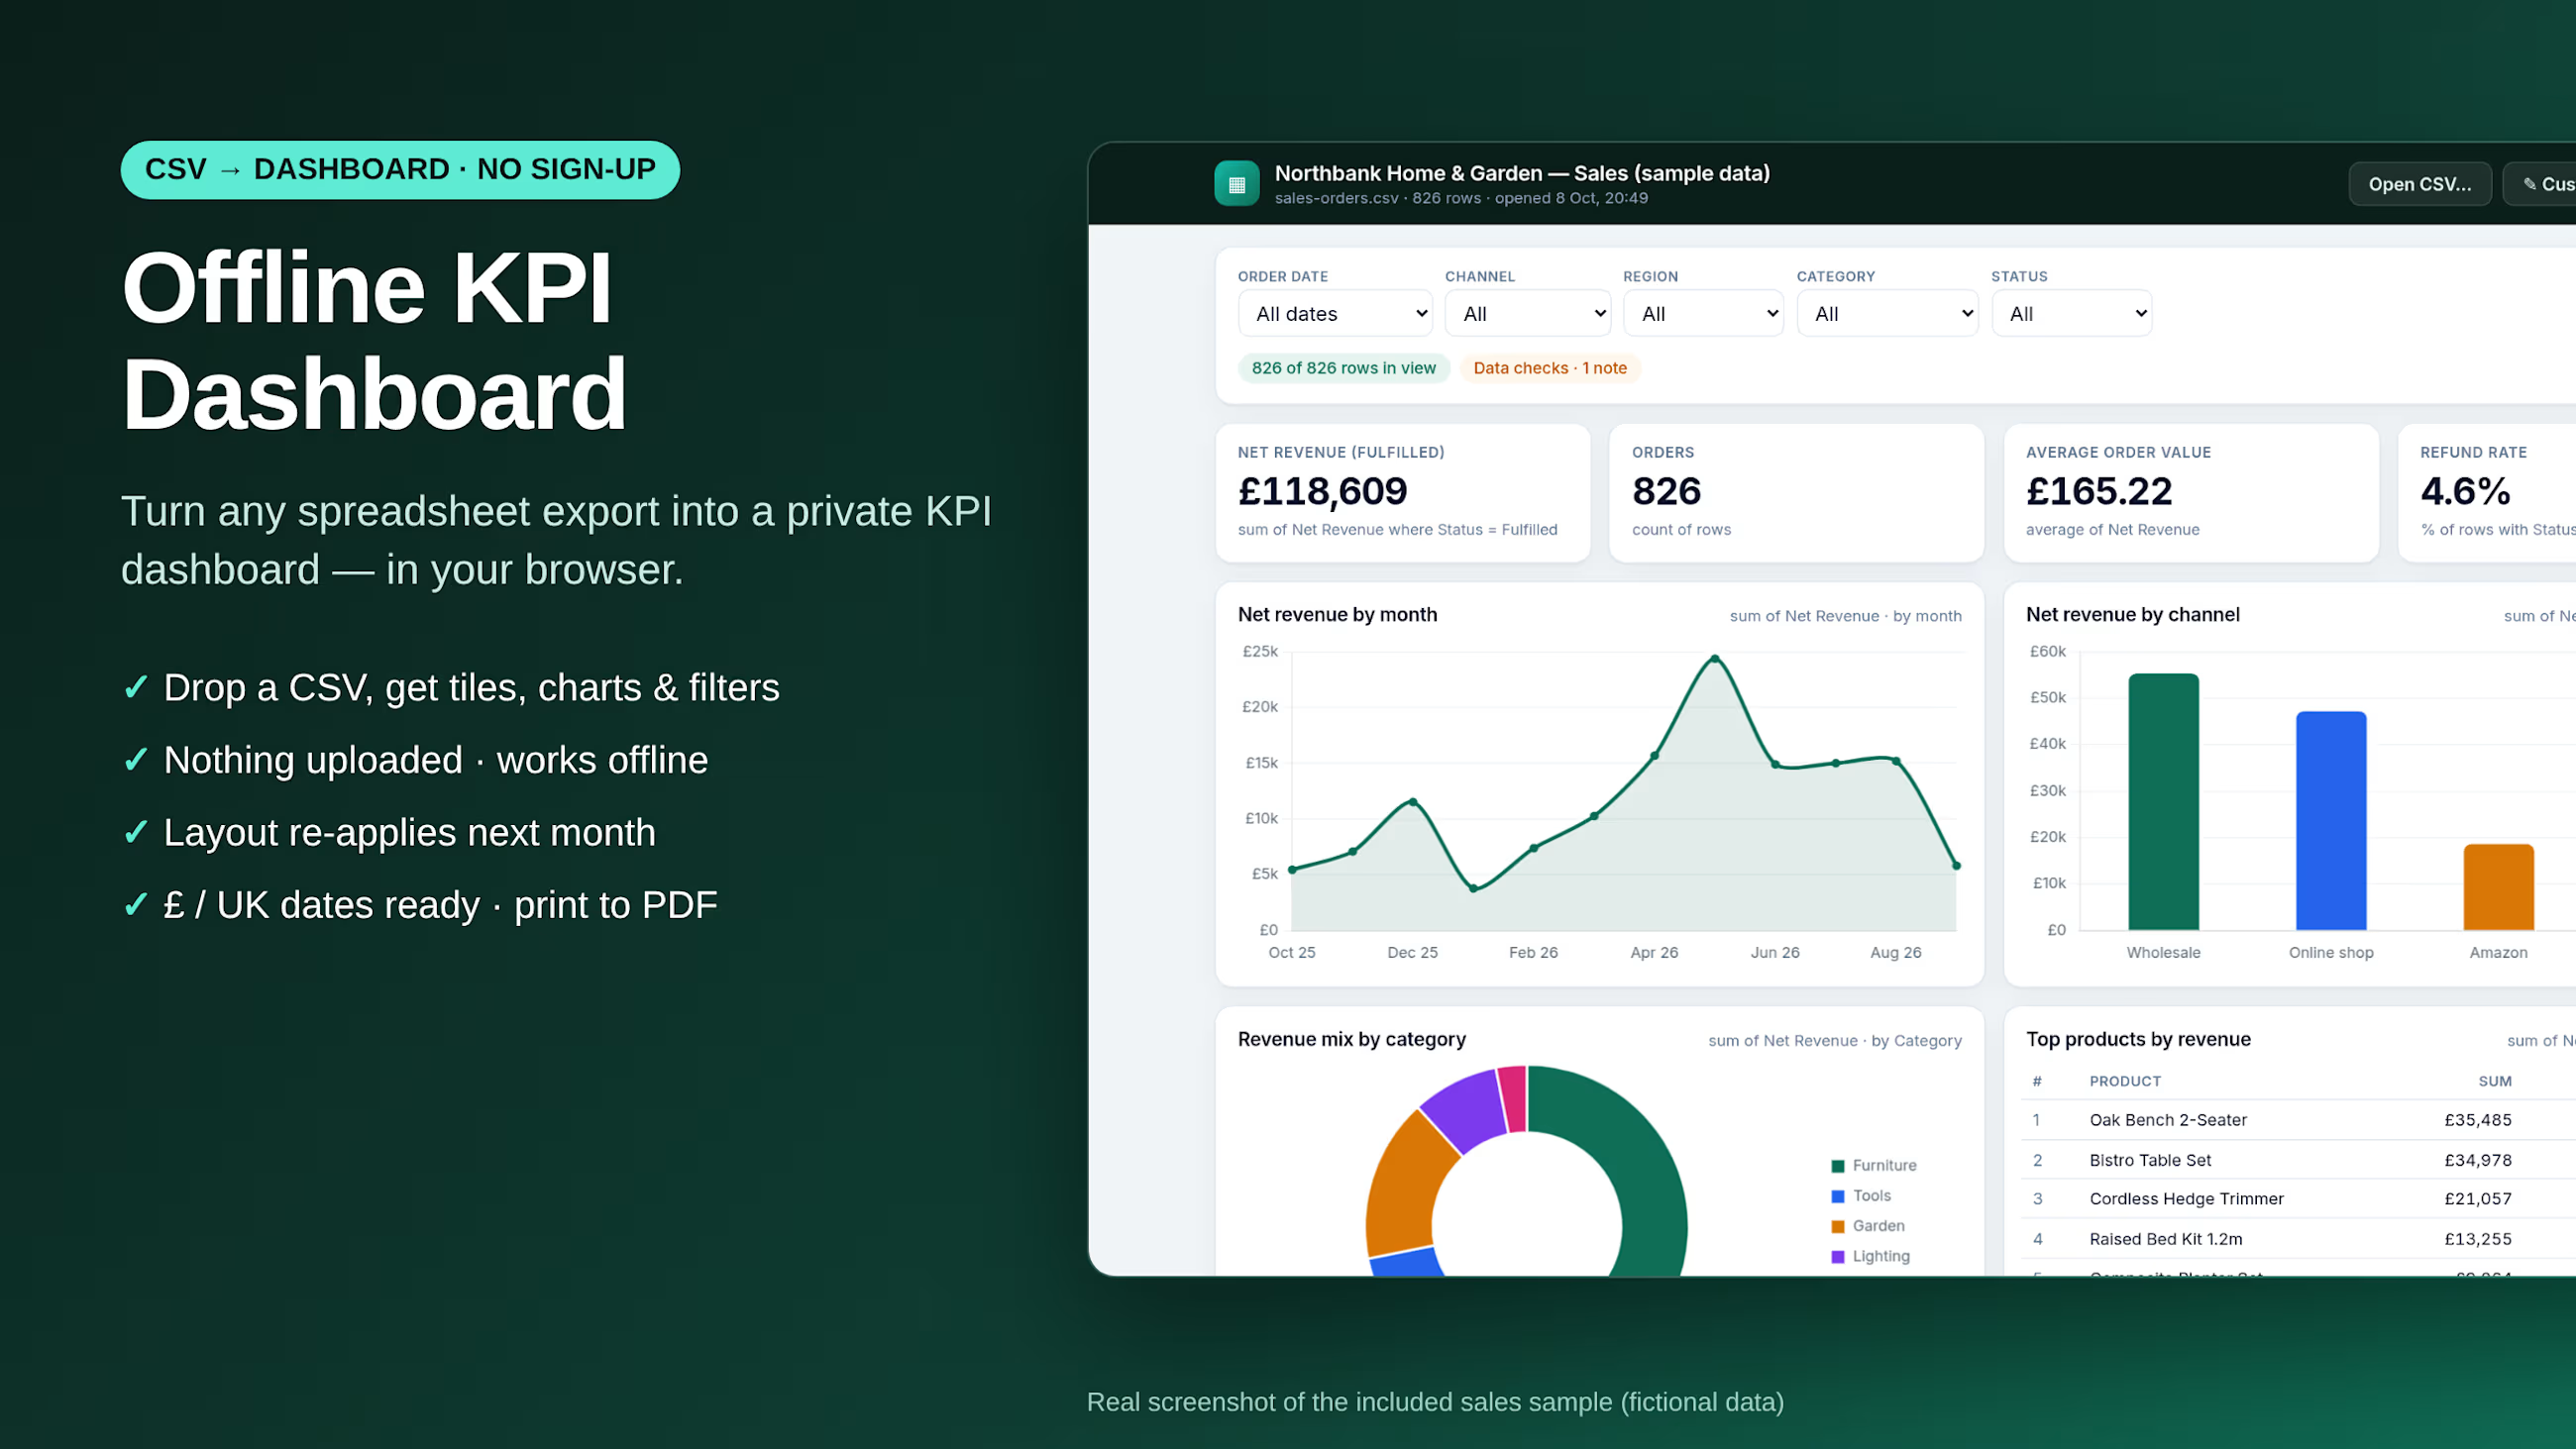
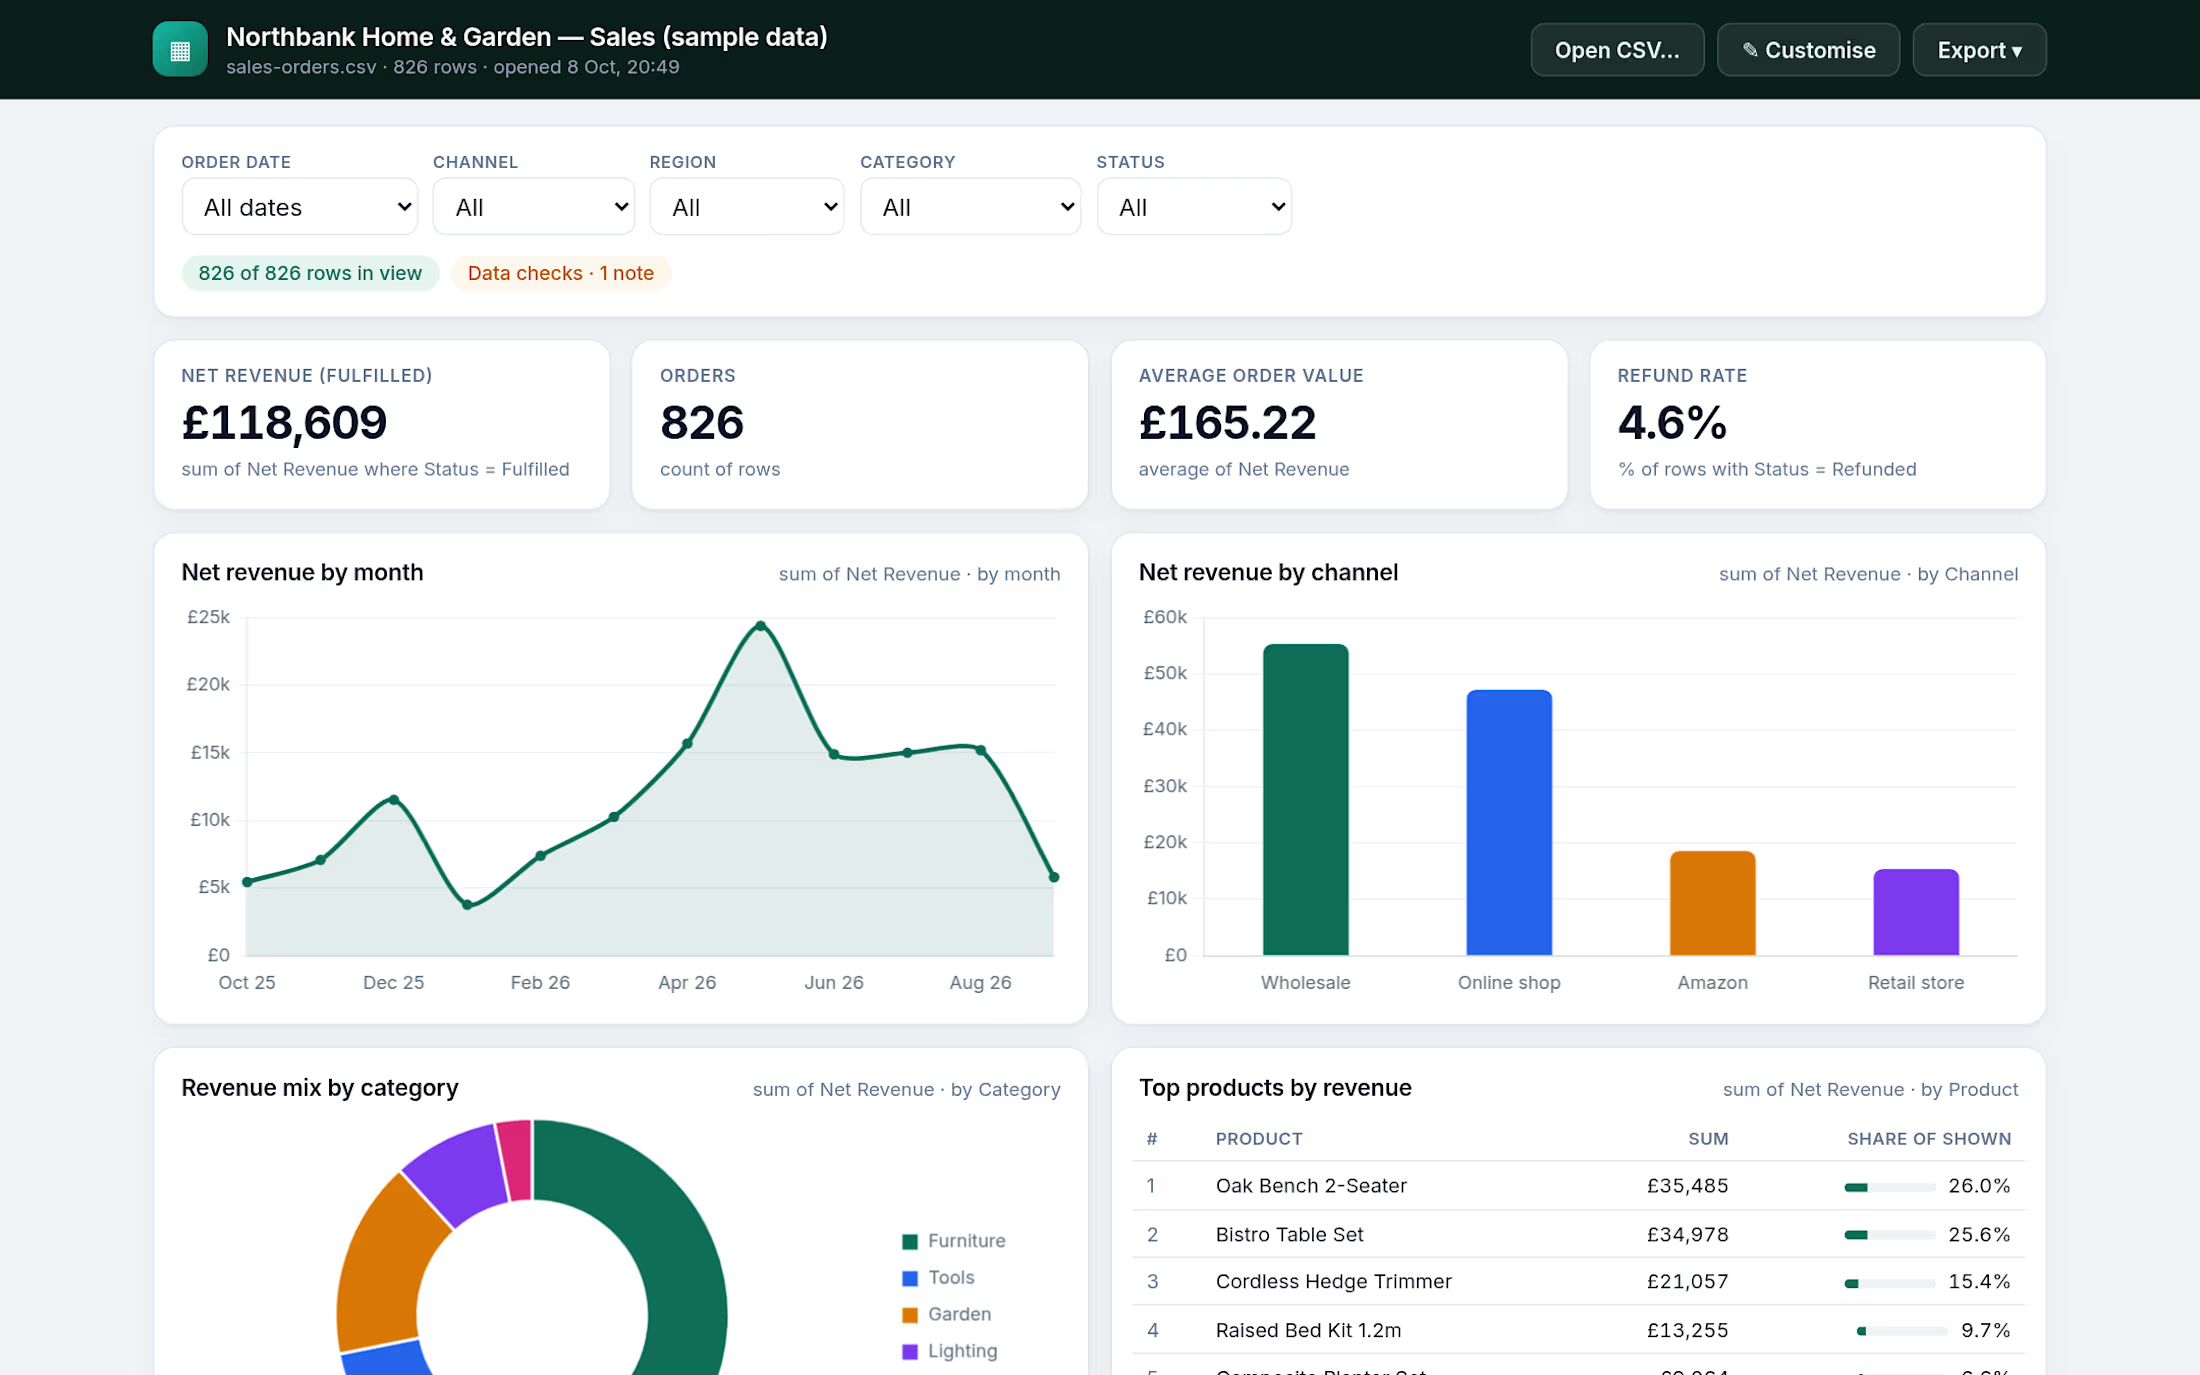
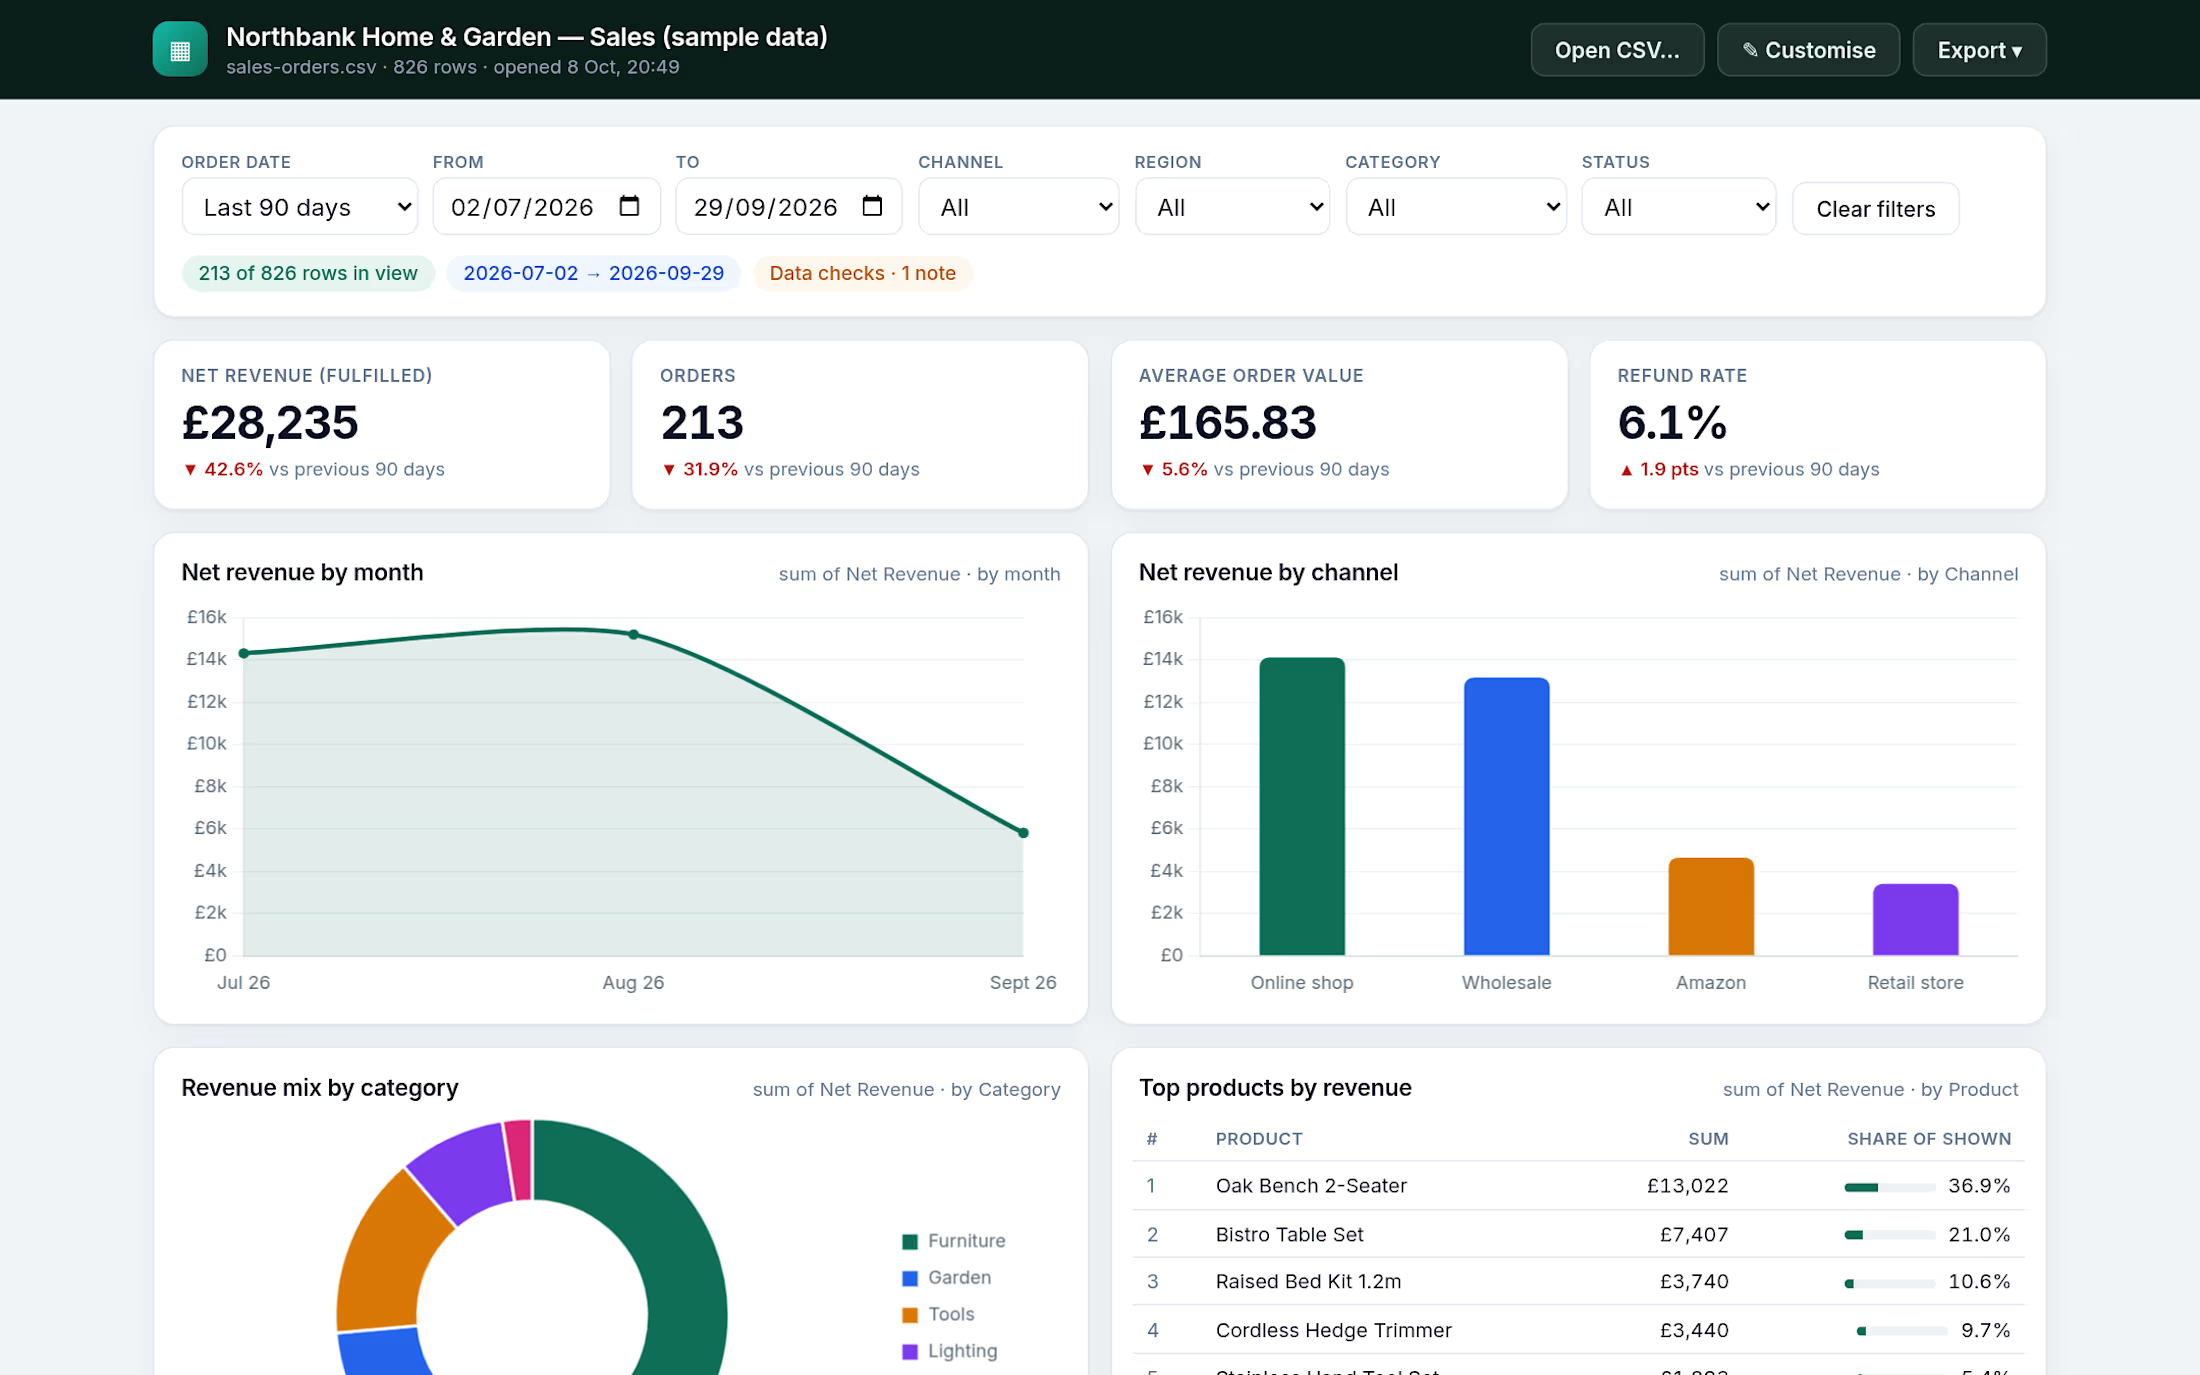
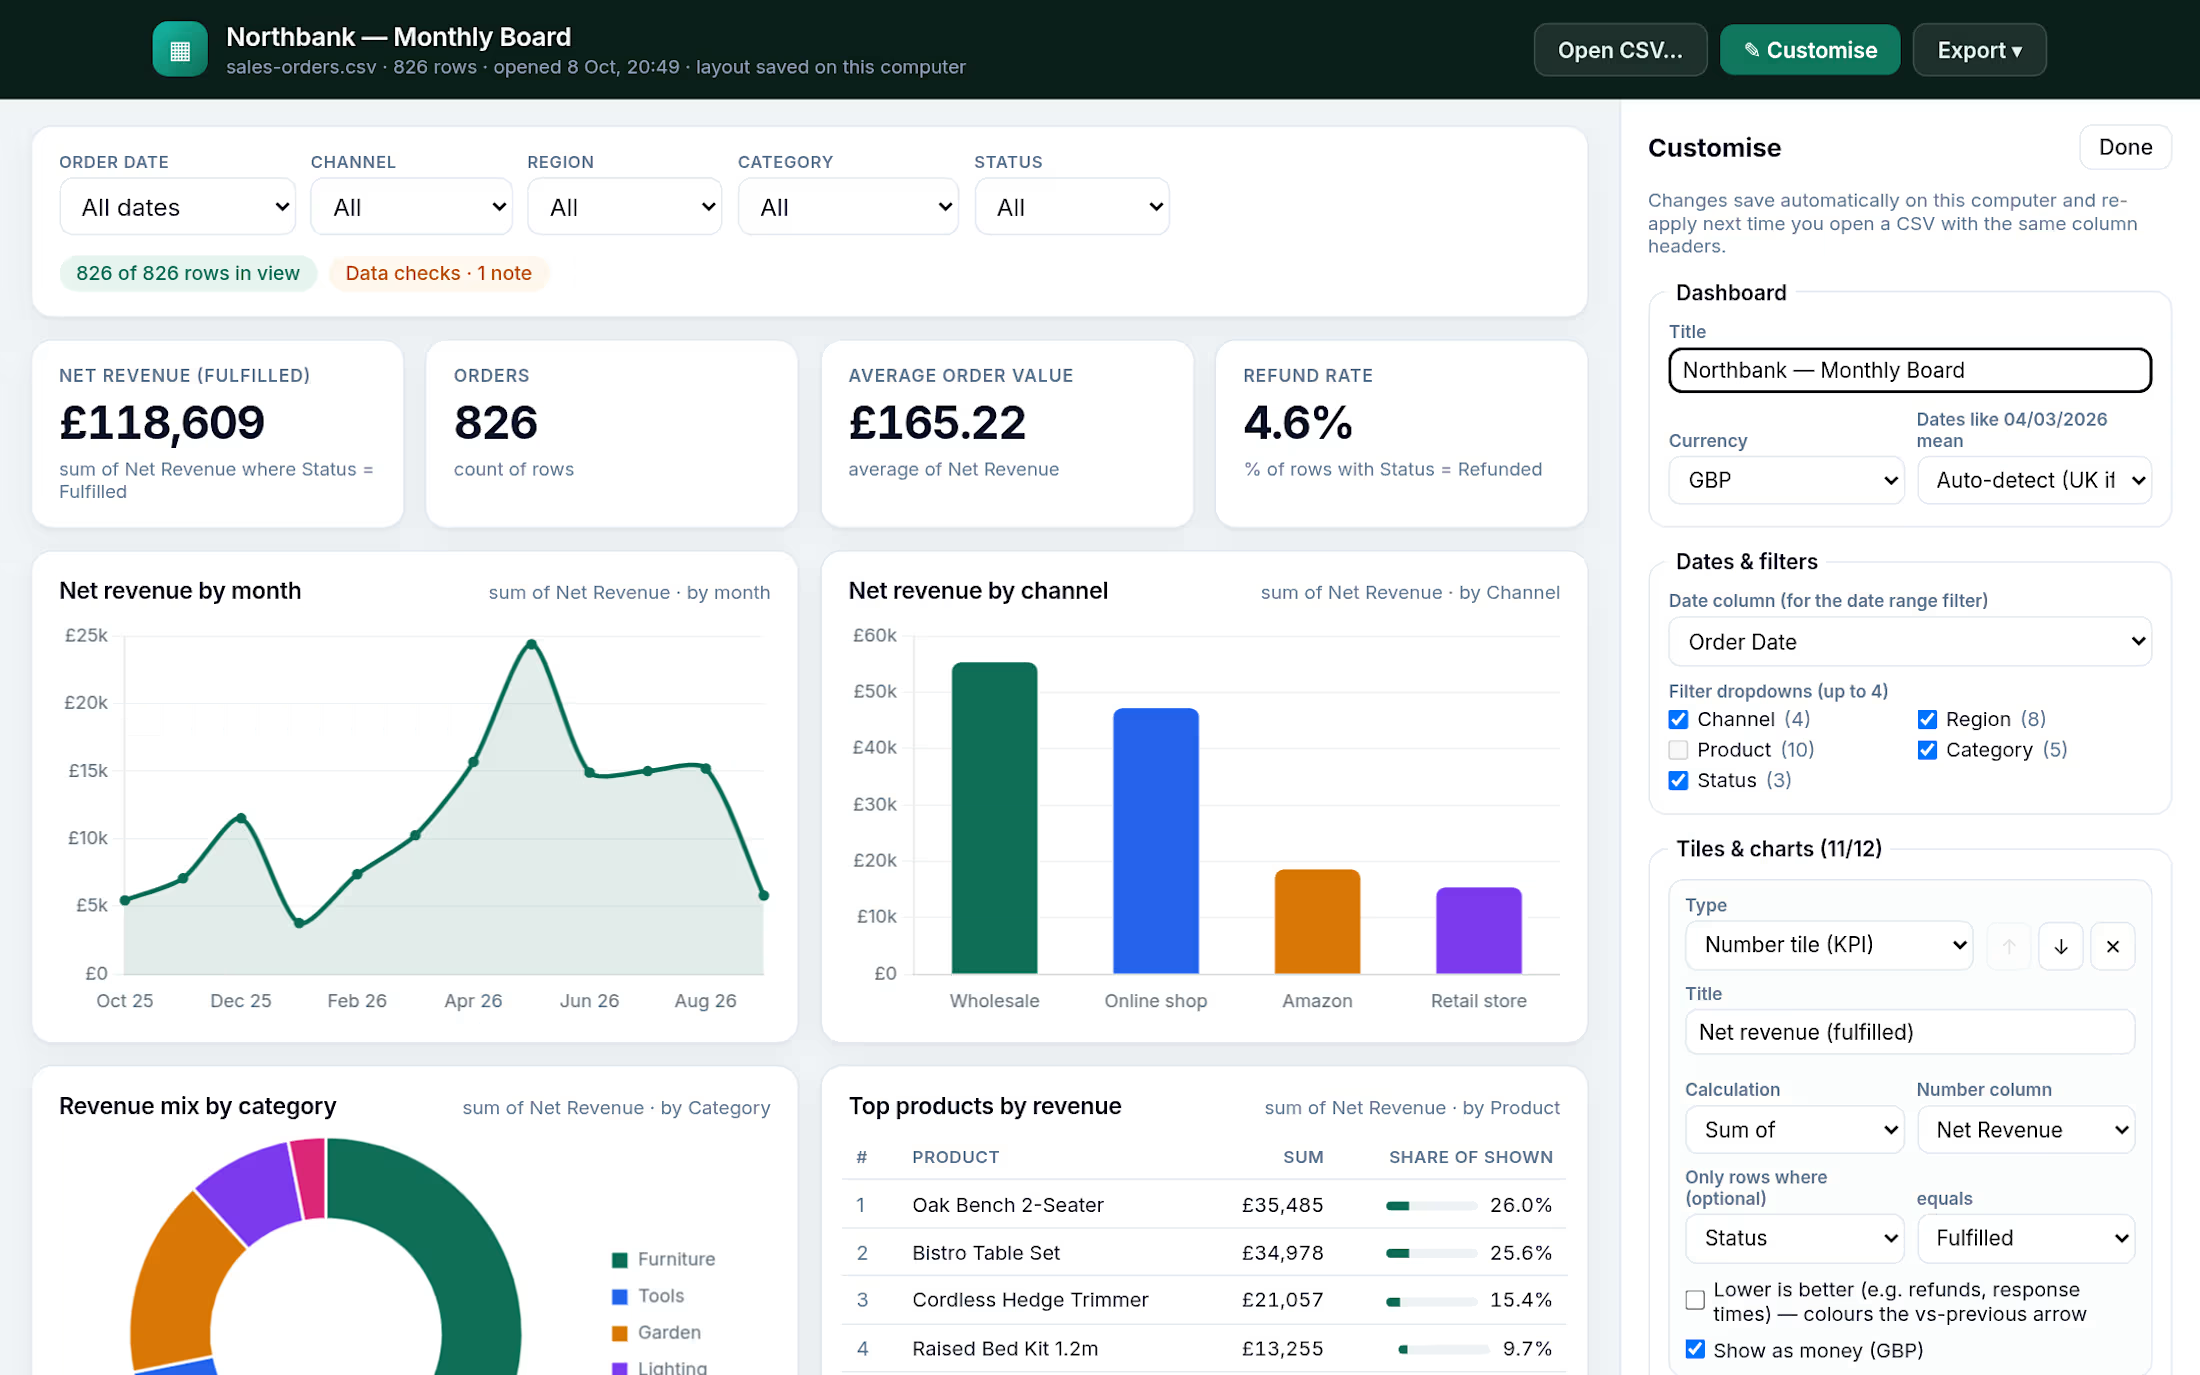
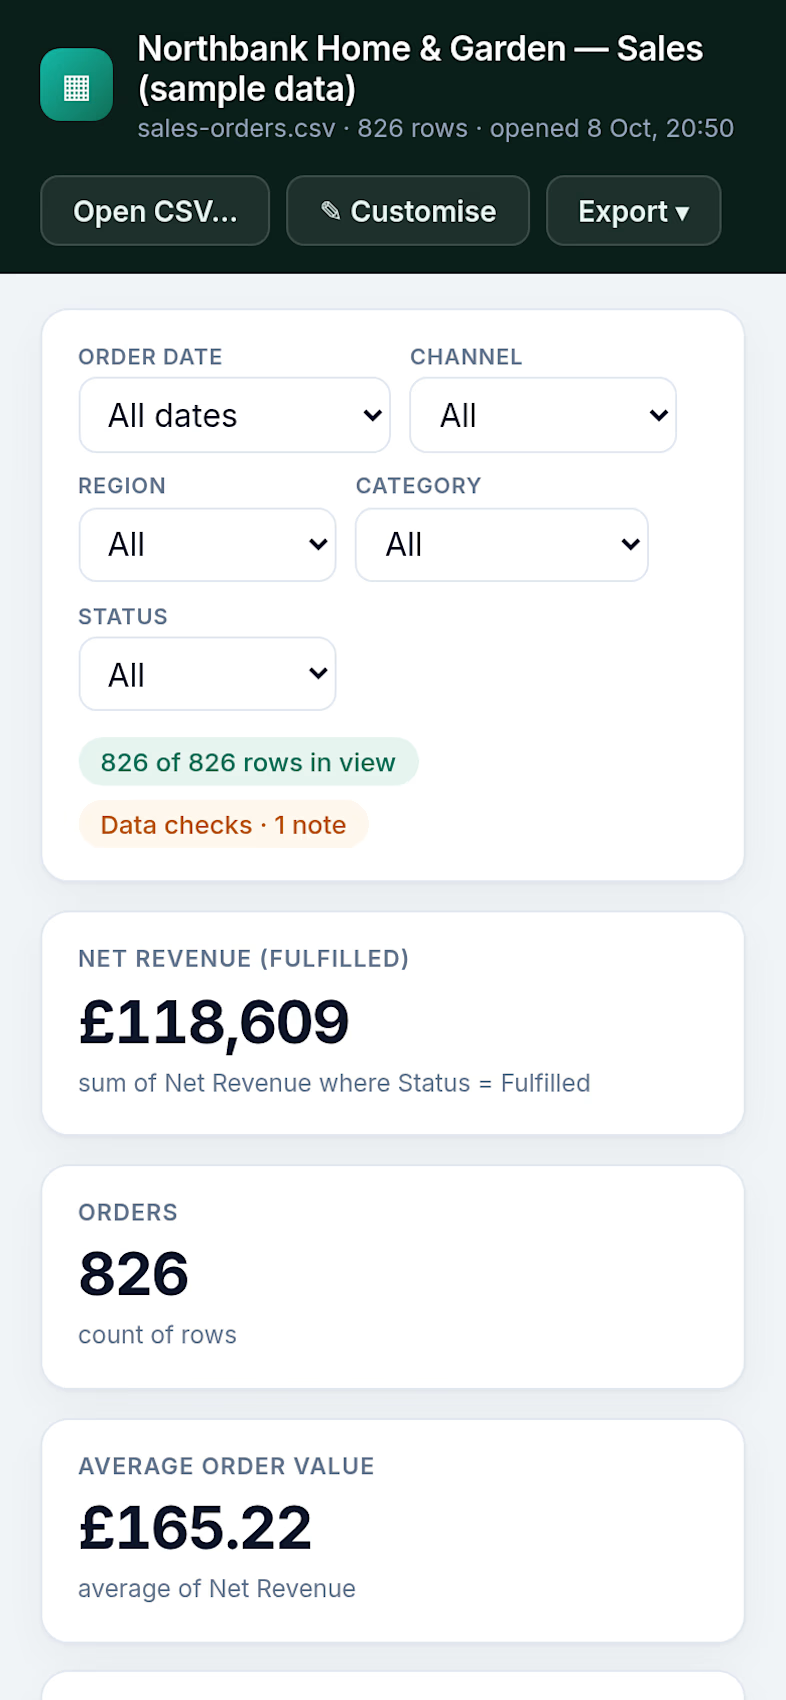
Offline KPI Dashboard is one file you double-click. It opens in your web browser, you drop your CSV on it, and it builds a dashboard from your columns: headline numbers, a trend over time, breakdowns by category, a top-10 table, filters and a date range with "vs previous period" comparisons. Change anything with a point-and-click Customise panel.
Next month, export the new file and drop it in — your layout comes back automatically when the columns match.
Private by design. The page reads your file on your computer and contains a browser security setting that blocks all network connections, so your figures can't be sent anywhere. It works offline. No account, no subscription, no install.
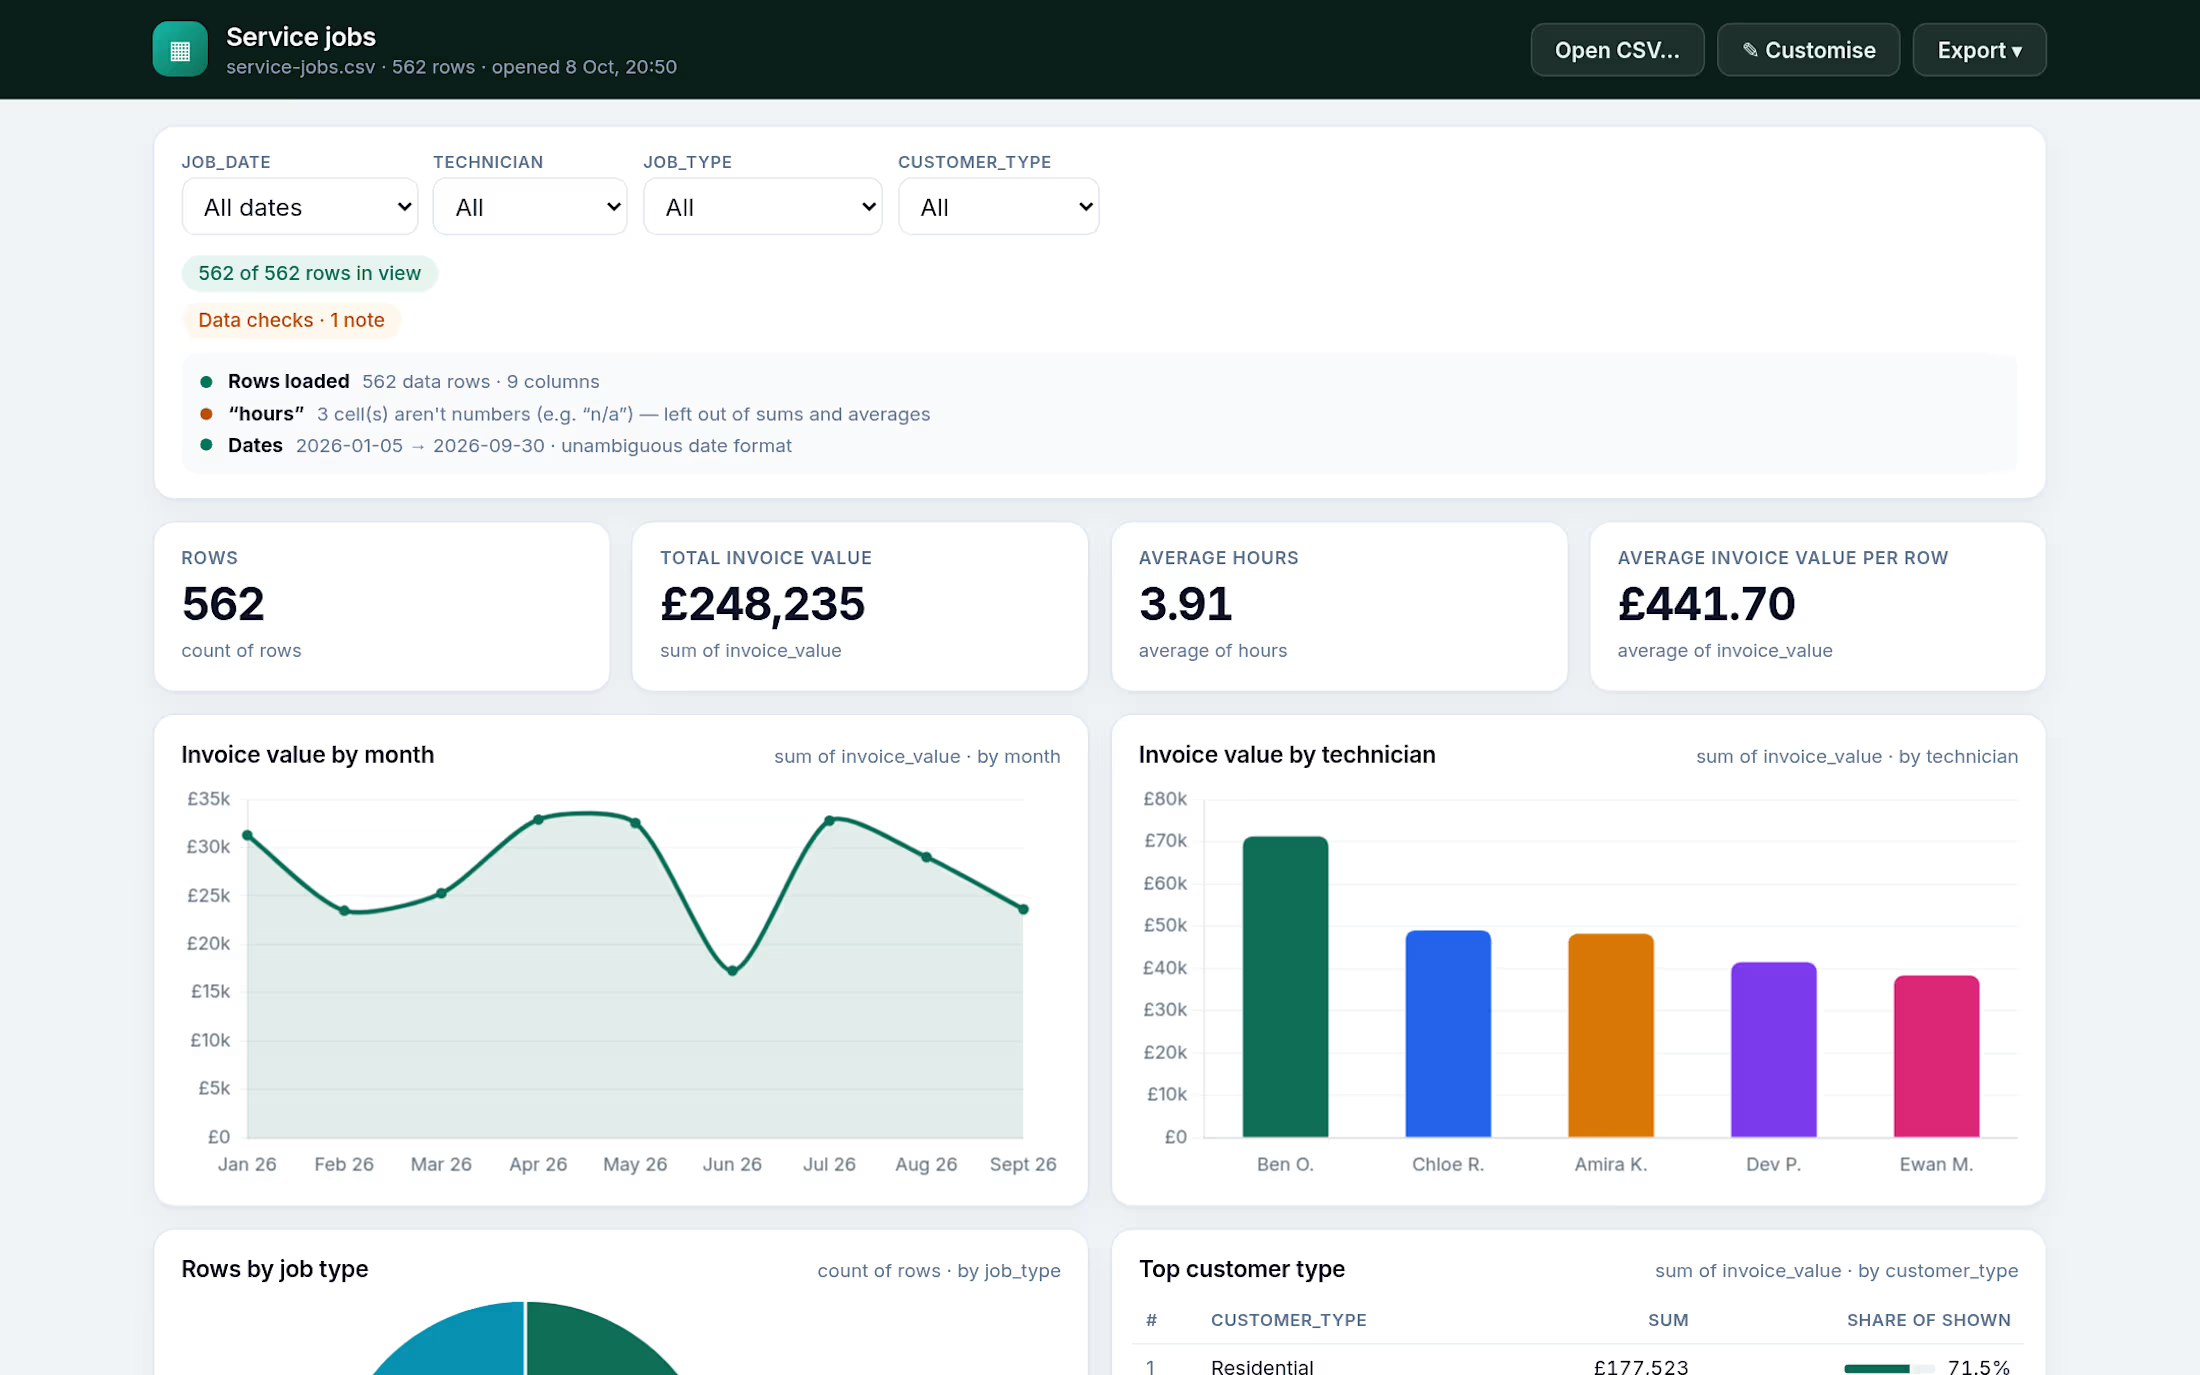
It tells you what it did. A Data checks panel reports rows read, blank lines skipped, cells that aren't numbers (e.g. "n/a" in an hours column) and how dates were read — instead of quietly giving you a wrong total.
Built for UK small businesses (£ amounts and DD/MM/YYYY dates understood out of the box) and works with $, €, A$, C$ and US dates too.
What you get
Dashboard in under a minute — drop a CSV, get suggested KPI tiles, charts and filters from your own column names.
Your data stays on your computer — no uploads, no account, works offline (the page is locked from using the network).
Repeatable monthly reporting — the layout re-applies automatically to next month's export with the same columns.
Point-and-click customising — up to 12 tiles: totals, averages, counts, distinct counts, "% of rows where…" (refund rate, first-time-fix rate), min/max; line, bar, doughnut, top-N and raw-row views.
Period comparisons — pick Last 30/90 days, latest month, year to date or custom dates; KPI tiles show ▲/▼ vs the previous period, with "lower is better" for things like refunds and response times.
Honest numbers — Data checks flag unreadable cells, blank lines and ambiguous dates rather than hiding them.
Share the results — print / save as PDF (with the filters used printed on the page), or download the filtered rows as a CSV.
Handles messy exports — £/$ symbols, thousands commas, (negative) brackets, percentages, comma/semicolon/tab-separated files, Excel's BOM, UK/US/ISO dates.
What's in the zip
KPI-Dashboard.html — the dashboard (single self-contained file, ~850 KB).
3 ready-made sample dashboards with fictional data: sales orders (826 rows, 12 months), service jobs (562 jobs, technicians, first-time-fix), support tickets (511 tickets, response times, CSAT) + a "next month" file to see layouts re-apply.
SETUP-GUIDE.pdf and SETUP.md — plain-English setup guide (getting CSVs out of Excel/Sheets/Numbers and business systems, customising, monthly routine, troubleshooting, honest limits).
LICENSE.txt — single-business commercial licence.
THIRD-PARTY-NOTICES.txt — open-source credits.
Requirements
A current web browser on a laptop or desktop computer. Automated tests passed in Google Chrome 154, Microsoft Edge 154, Mozilla Firefox 157 and WebKit 27.2 (the engine Apple Safari is built on), including an iPad-sized touch-screen emulation, all run on Linux. Not yet tried in Apple Safari on a real Mac or on a real iPad. Your data must be (or be saved as) a CSV with column headers in the first row.
What it doesn't do
No live data connections or auto-refresh. It doesn't connect to Shopify, Xero, QuickBooks, Google Sheets or any other system. You refresh it by exporting a new CSV and opening that.
No multi-user sharing or cloud sync. It runs on one computer at a time. Nothing is stored online, and there's no shared link or login. Share results as PDFs, screenshots or exported rows. Layouts move between computers as a small layout file.
No editing of your data. It reads your CSV and never changes it. Corrections belong in your source system or spreadsheet.
No .xlsx, Numbers or Google Sheets files directly. CSV (and tab-separated text) only. Save or download as CSV first; other files get a plain-English message instead of loading.
No joining of files. One CSV at a time, so it can't combine e.g. orders and customers.
No decimal-comma numbers (1.234,56). Those cells are flagged in Data checks rather than misread.
Very large files: tested at 100,000 rows (a 4.6 MB file opened in about 1.3 s). Much bigger files may be slow, depending on your computer, and files over 200 MB are refused.
No custom colours or chart styling. You choose what's shown, not how it looks.
Browsers: tested only in the browsers named under Requirements, all on a Linux test machine. Not yet tried in Apple Safari on a real Mac, on a real iPad or iPhone, or on Windows or macOS computers.
Not accounting, forecasting or BI software. It summarises the rows you give it: sums, averages, counts, percentages, trends and top lists.
FAQ
Do I need to install anything or create an account? No. Unzip, double-click KPI-Dashboard.html, and it opens in your browser.
Is my data uploaded anywhere? No. The file is read by the page on your computer. The page includes a browser security policy that blocks all network connections, and it works with your internet switched off. Only your layout settings (not your data) are remembered by your browser.
Which systems does it work with? Anything that can export a CSV with column headers — online shops, tills/POS, accounting, invoicing, booking, CRM and helpdesk tools, plus Excel, Google Sheets and Numbers (save/download as CSV). It doesn't connect to those systems directly.
Will it work with my Excel file? Save the sheet as CSV first (File → Save As → CSV UTF-8). The guide shows how.
Does it update automatically? It's not a live feed. Each week/month you export a fresh CSV and drop it in; your saved layout re-applies if the columns are the same.
Can my team use it? Yes — one licence covers everyone in your business. Share PDFs/screenshots with anyone. To give a team a hosted link with a password, see the custom option below.
Mac or Windows? Either, because it runs in the browser. The full test suite passed in Chrome, Edge, Firefox and WebKit (Safari's engine), all on a Linux test machine. It hasn't yet been tried in Apple Safari on a real Mac, so if anything looks off there, use Chrome, Edge or Firefox and let me know.
How big a file can it handle? It was tested at 100,000 rows, where a 4.6 MB file opened and rendered in about 1.3 seconds in Chrome. Bigger files work but get slower depending on your computer, and files over 200 MB are refused.
Can I change the colours or add my logo? Not in v1 — you control titles, tiles, calculations and filters; styling is fixed.
What if it can't read some of my data? The Data checks panel tells you which column and shows an example of the cell it couldn't read, so you can fix it at source.
Refunds? Follow the platform's digital-download policy. Please read "What it doesn't do" above before buying; if a file won't load, message me and I'll help.
Can you build a custom version for my business? Yes, as a separate fixed-price service: a hosted dashboard with a shared-password login, built around your exact exports, up to 6 charts/tables, 5 business days, $399 — CSV Ops Dashboard Mini. The dashboard is complete on its own; most small teams won't need this.
Built with AI assistance, then tested with automated checks in Chromium, Firefox and WebKit (Safari's engine) before release.
Get it for$29.00
Tags
Google Sheets

Microsoft Excel

Data Visualizer
Product created by
Chris Elder London, UK
Chris's other products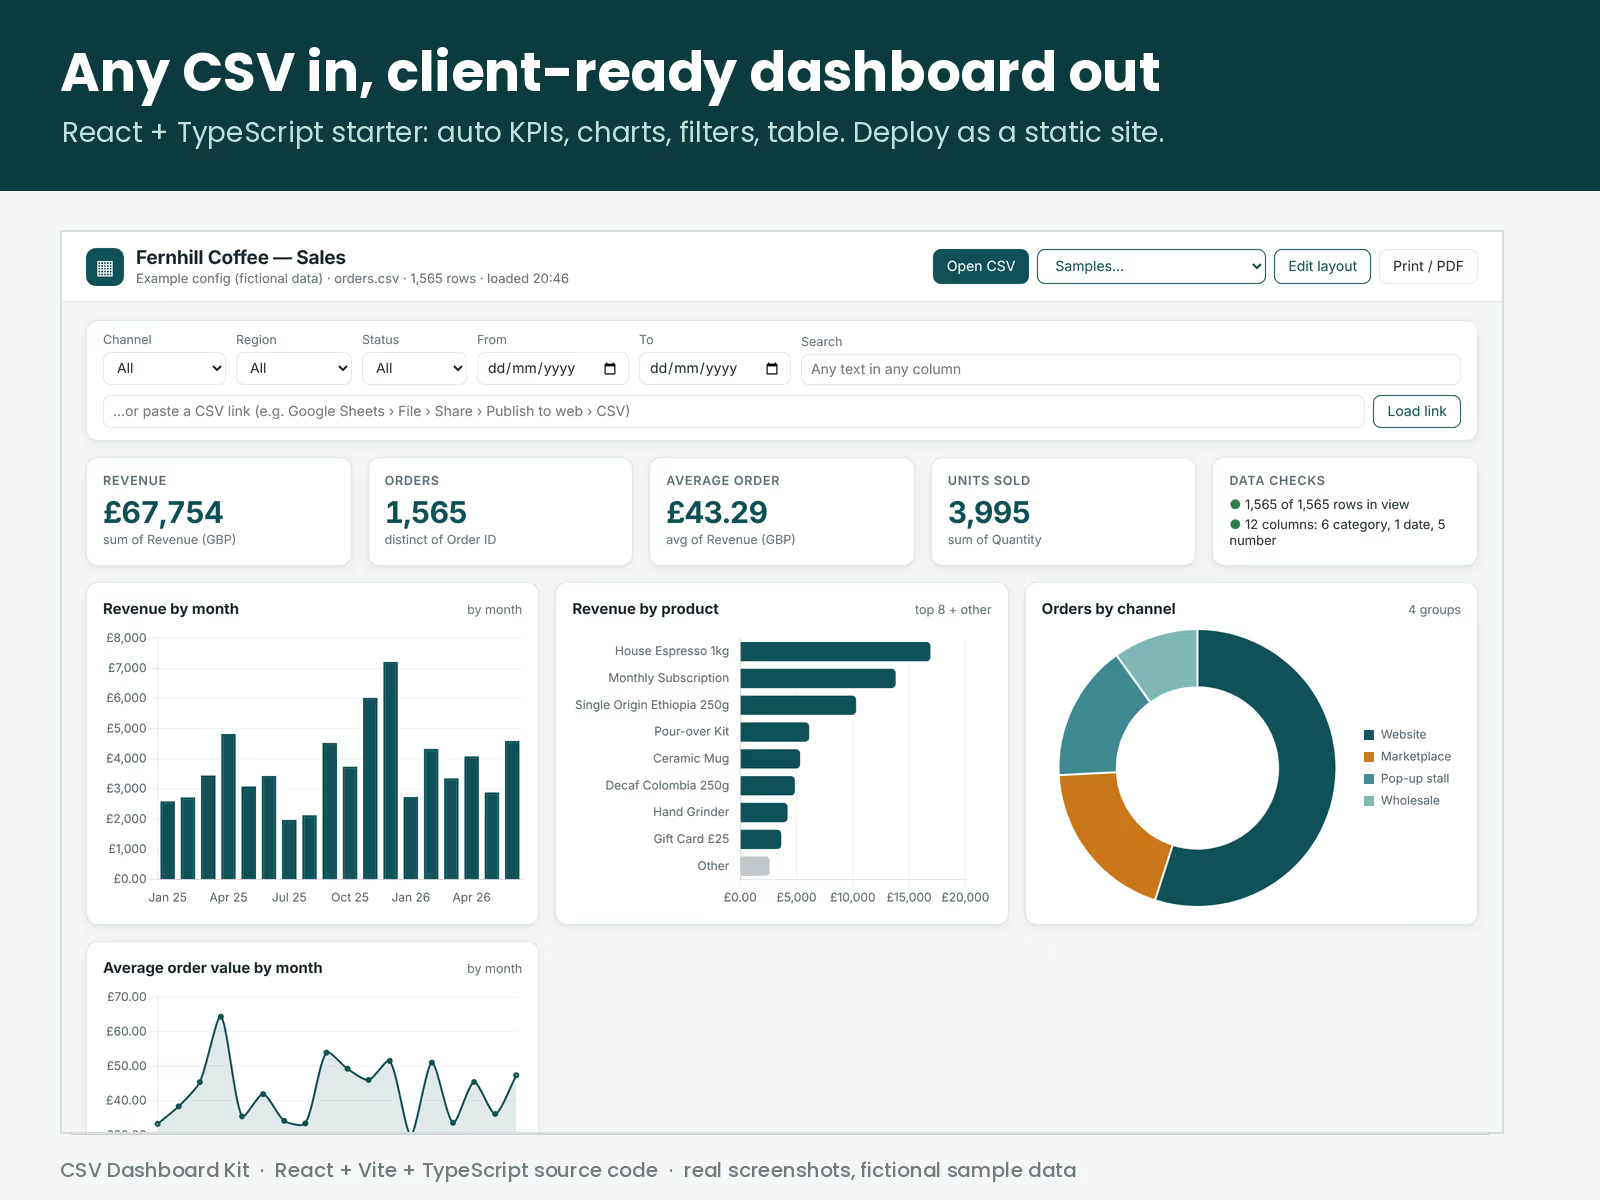
CSV Dashboard Kit – React + TS source
$49.00
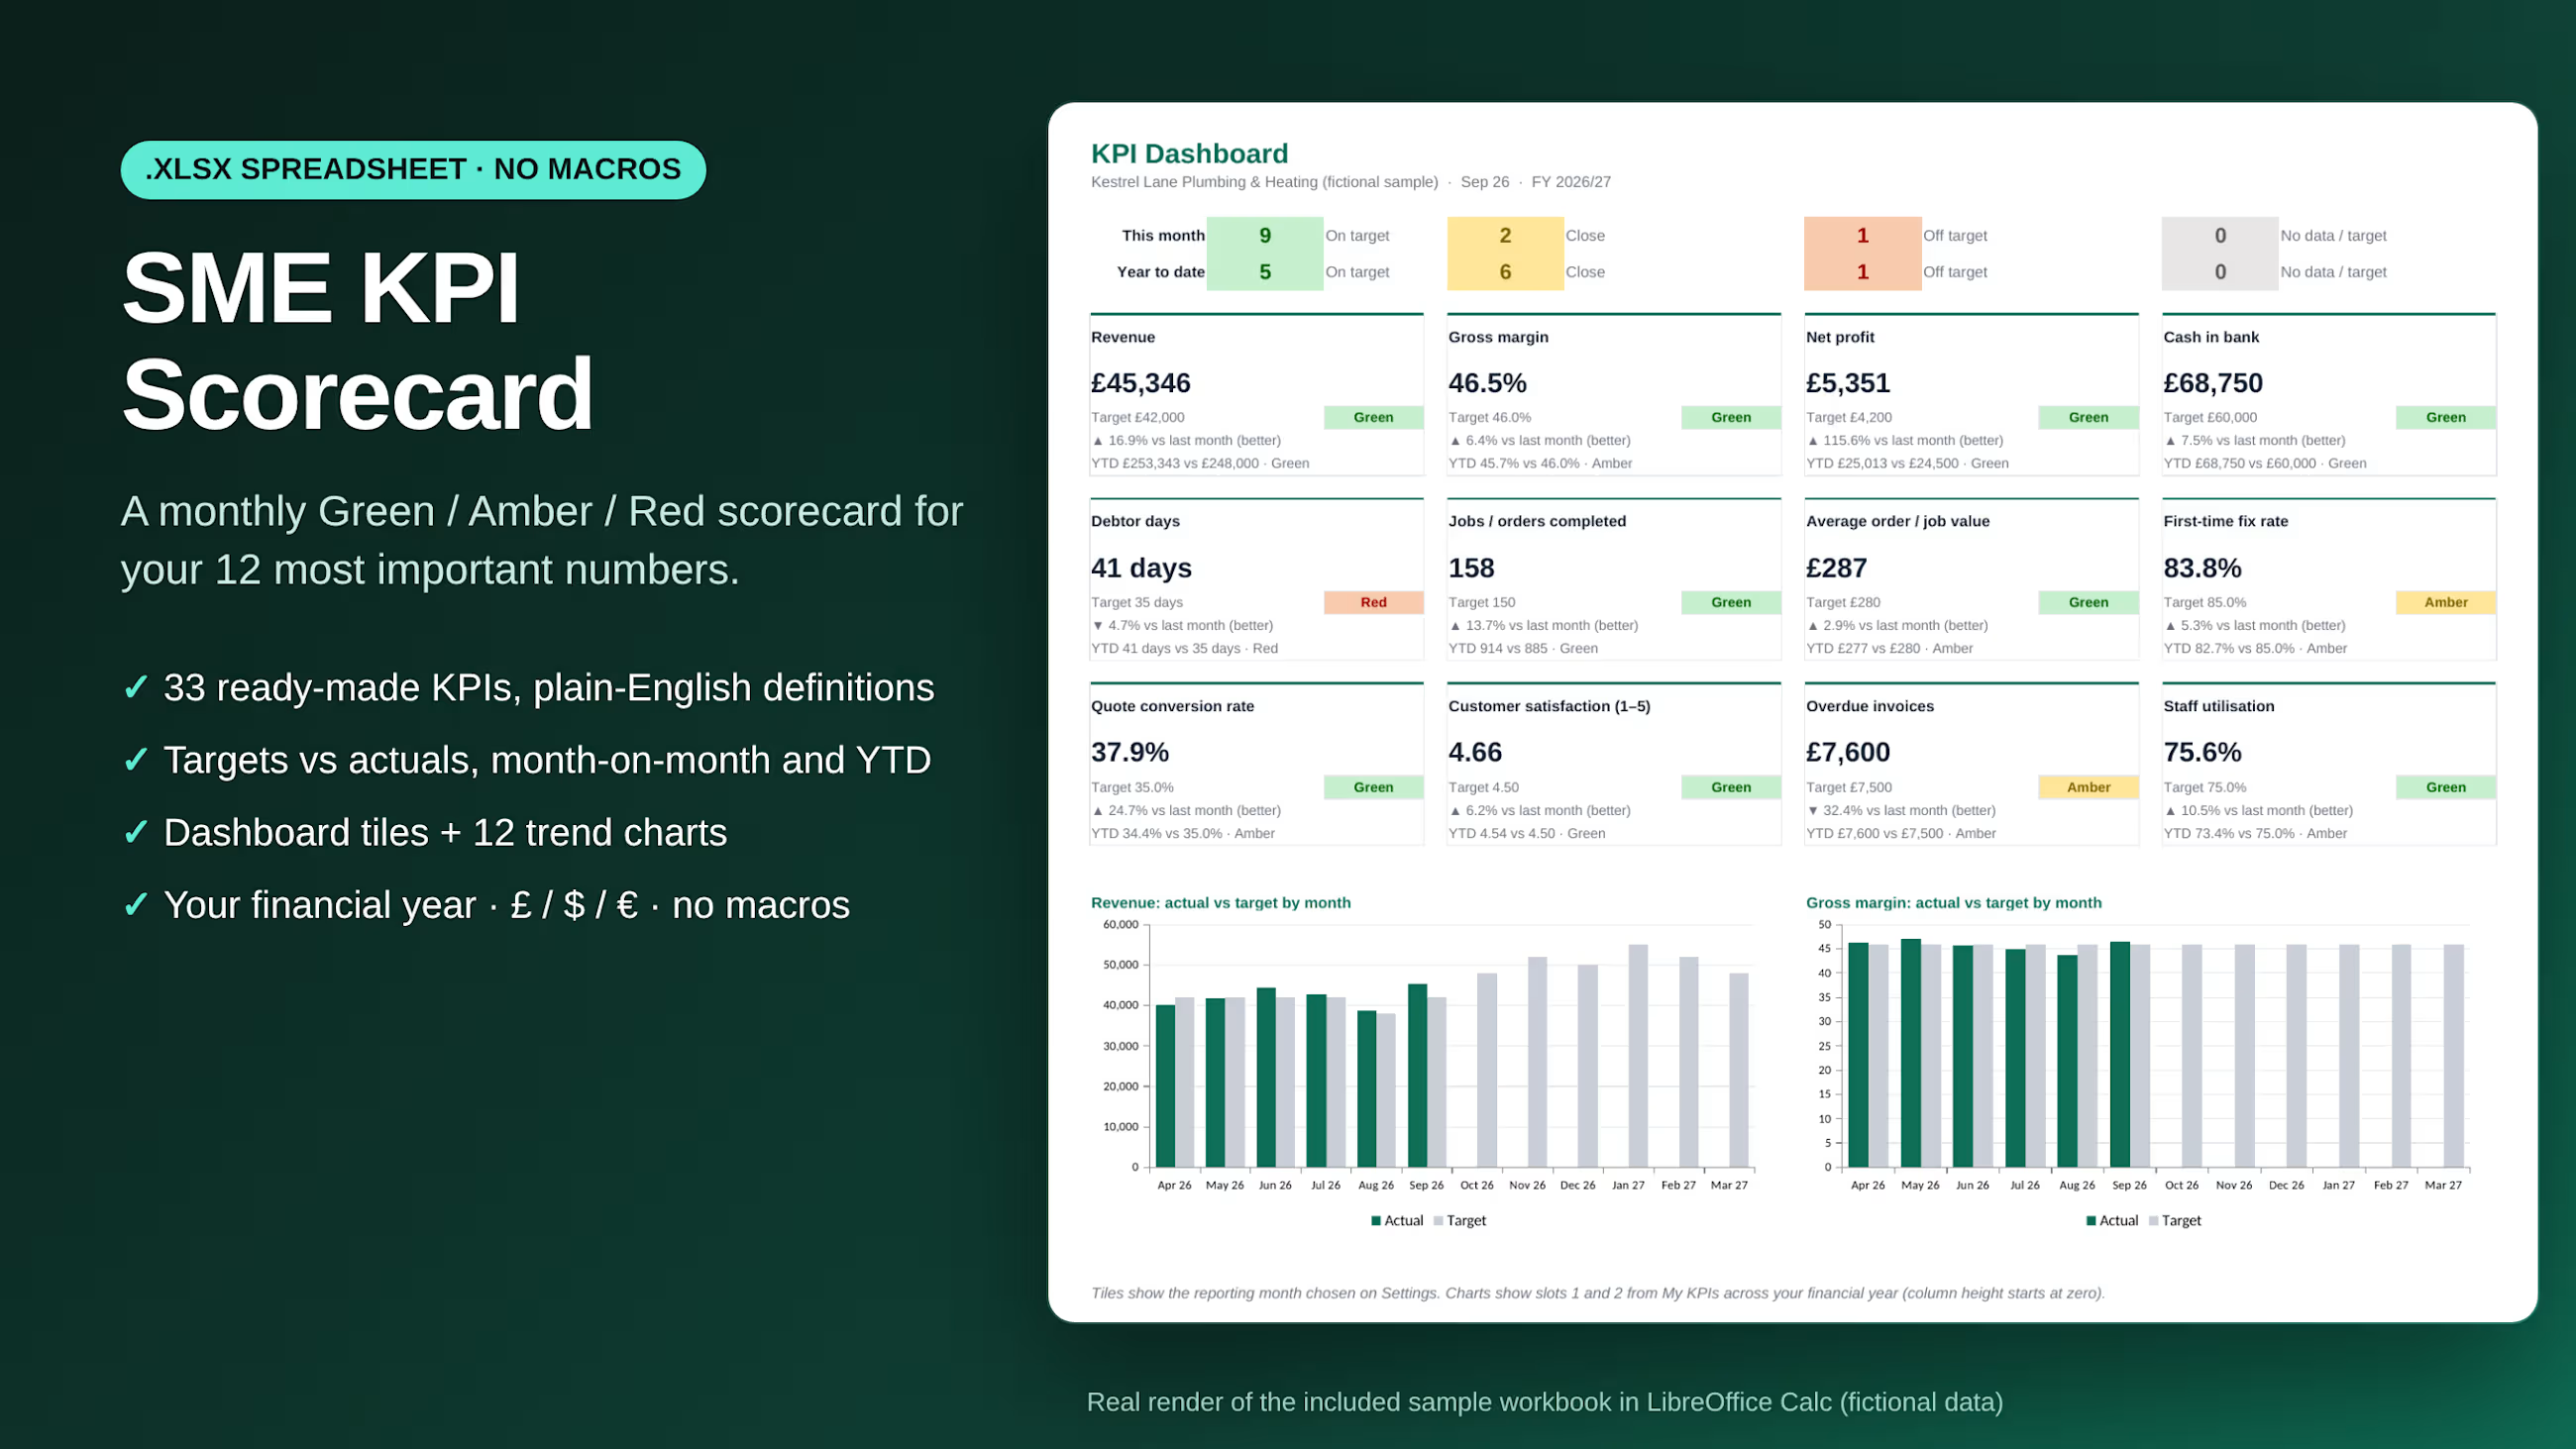
SME KPI Scorecard: Monthly Targets vs Actuals, Green/Amber/Red
$24.00
Get it for$29.00
Tags
Google Sheets
Microsoft Excel
Data Visualizer
Drop in a CSV from your shop, accounting, booking or helpdesk system and get tiles, charts and filters in seconds — in your browser, with nothing uploaded and no sign-up.
You already have the data. Your shop, till, accounting package, booking tool or helpdesk will export it as a CSV. The problem is what happens next: another evening of pivot tables, or another monthly subscription for a dashboard tool that wants your data on its servers.
Offline KPI Dashboard is one file you double-click. It opens in your web browser, you drop your CSV on it, and it builds a dashboard from your columns: headline numbers, a trend over time, breakdowns by category, a top-10 table, filters and a date range with "vs previous period" comparisons. Change anything with a point-and-click Customise panel.
Next month, export the new file and drop it in — your layout comes back automatically when the columns match.
Private by design. The page reads your file on your computer and contains a browser security setting that blocks all network connections, so your figures can't be sent anywhere. It works offline. No account, no subscription, no install.
It tells you what it did. A Data checks panel reports rows read, blank lines skipped, cells that aren't numbers (e.g. "n/a" in an hours column) and how dates were read — instead of quietly giving you a wrong total.
Built for UK small businesses (£ amounts and DD/MM/YYYY dates understood out of the box) and works with $, €, A$, C$ and US dates too.
What you get
Dashboard in under a minute — drop a CSV, get suggested KPI tiles, charts and filters from your own column names.
Your data stays on your computer — no uploads, no account, works offline (the page is locked from using the network).
Repeatable monthly reporting — the layout re-applies automatically to next month's export with the same columns.
Point-and-click customising — up to 12 tiles: totals, averages, counts, distinct counts, "% of rows where…" (refund rate, first-time-fix rate), min/max; line, bar, doughnut, top-N and raw-row views.
Period comparisons — pick Last 30/90 days, latest month, year to date or custom dates; KPI tiles show ▲/▼ vs the previous period, with "lower is better" for things like refunds and response times.
Honest numbers — Data checks flag unreadable cells, blank lines and ambiguous dates rather than hiding them.
Share the results — print / save as PDF (with the filters used printed on the page), or download the filtered rows as a CSV.
Handles messy exports — £/$ symbols, thousands commas, (negative) brackets, percentages, comma/semicolon/tab-separated files, Excel's BOM, UK/US/ISO dates.
What's in the zip
KPI-Dashboard.html — the dashboard (single self-contained file, ~850 KB).
3 ready-made sample dashboards with fictional data: sales orders (826 rows, 12 months), service jobs (562 jobs, technicians, first-time-fix), support tickets (511 tickets, response times, CSAT) + a "next month" file to see layouts re-apply.
SETUP-GUIDE.pdf and SETUP.md — plain-English setup guide (getting CSVs out of Excel/Sheets/Numbers and business systems, customising, monthly routine, troubleshooting, honest limits).
LICENSE.txt — single-business commercial licence.
THIRD-PARTY-NOTICES.txt — open-source credits.
Requirements
A current web browser on a laptop or desktop computer. Automated tests passed in Google Chrome 154, Microsoft Edge 154, Mozilla Firefox 157 and WebKit 27.2 (the engine Apple Safari is built on), including an iPad-sized touch-screen emulation, all run on Linux. Not yet tried in Apple Safari on a real Mac or on a real iPad. Your data must be (or be saved as) a CSV with column headers in the first row.
What it doesn't do
No live data connections or auto-refresh. It doesn't connect to Shopify, Xero, QuickBooks, Google Sheets or any other system. You refresh it by exporting a new CSV and opening that.
No multi-user sharing or cloud sync. It runs on one computer at a time. Nothing is stored online, and there's no shared link or login. Share results as PDFs, screenshots or exported rows. Layouts move between computers as a small layout file.
No editing of your data. It reads your CSV and never changes it. Corrections belong in your source system or spreadsheet.
No .xlsx, Numbers or Google Sheets files directly. CSV (and tab-separated text) only. Save or download as CSV first; other files get a plain-English message instead of loading.
No joining of files. One CSV at a time, so it can't combine e.g. orders and customers.
No decimal-comma numbers (1.234,56). Those cells are flagged in Data checks rather than misread.
Very large files: tested at 100,000 rows (a 4.6 MB file opened in about 1.3 s). Much bigger files may be slow, depending on your computer, and files over 200 MB are refused.
No custom colours or chart styling. You choose what's shown, not how it looks.
Browsers: tested only in the browsers named under Requirements, all on a Linux test machine. Not yet tried in Apple Safari on a real Mac, on a real iPad or iPhone, or on Windows or macOS computers.
Not accounting, forecasting or BI software. It summarises the rows you give it: sums, averages, counts, percentages, trends and top lists.
FAQ
Do I need to install anything or create an account? No. Unzip, double-click KPI-Dashboard.html, and it opens in your browser.
Is my data uploaded anywhere? No. The file is read by the page on your computer. The page includes a browser security policy that blocks all network connections, and it works with your internet switched off. Only your layout settings (not your data) are remembered by your browser.
Which systems does it work with? Anything that can export a CSV with column headers — online shops, tills/POS, accounting, invoicing, booking, CRM and helpdesk tools, plus Excel, Google Sheets and Numbers (save/download as CSV). It doesn't connect to those systems directly.
Will it work with my Excel file? Save the sheet as CSV first (File → Save As → CSV UTF-8). The guide shows how.
Does it update automatically? It's not a live feed. Each week/month you export a fresh CSV and drop it in; your saved layout re-applies if the columns are the same.
Can my team use it? Yes — one licence covers everyone in your business. Share PDFs/screenshots with anyone. To give a team a hosted link with a password, see the custom option below.
Mac or Windows? Either, because it runs in the browser. The full test suite passed in Chrome, Edge, Firefox and WebKit (Safari's engine), all on a Linux test machine. It hasn't yet been tried in Apple Safari on a real Mac, so if anything looks off there, use Chrome, Edge or Firefox and let me know.
How big a file can it handle? It was tested at 100,000 rows, where a 4.6 MB file opened and rendered in about 1.3 seconds in Chrome. Bigger files work but get slower depending on your computer, and files over 200 MB are refused.
Can I change the colours or add my logo? Not in v1 — you control titles, tiles, calculations and filters; styling is fixed.
What if it can't read some of my data? The Data checks panel tells you which column and shows an example of the cell it couldn't read, so you can fix it at source.
Refunds? Follow the platform's digital-download policy. Please read "What it doesn't do" above before buying; if a file won't load, message me and I'll help.
Can you build a custom version for my business? Yes, as a separate fixed-price service: a hosted dashboard with a shared-password login, built around your exact exports, up to 6 charts/tables, 5 business days, $399 — CSV Ops Dashboard Mini. The dashboard is complete on its own; most small teams won't need this.
Built with AI assistance, then tested with automated checks in Chromium, Firefox and WebKit (Safari's engine) before release.
Chris's other products
CSV Dashboard Kit – React + TS source
$49.00
SME KPI Scorecard: Monthly Targets vs Actuals, Green/Amber/Red
$24.00
$29.00