Projects using Google BigQuery
Projects using Google BigQuery
Sign Up
Post a job
Sign Up
Log In
Filters
1
Projects
People
Message
8
Sam Fairweather
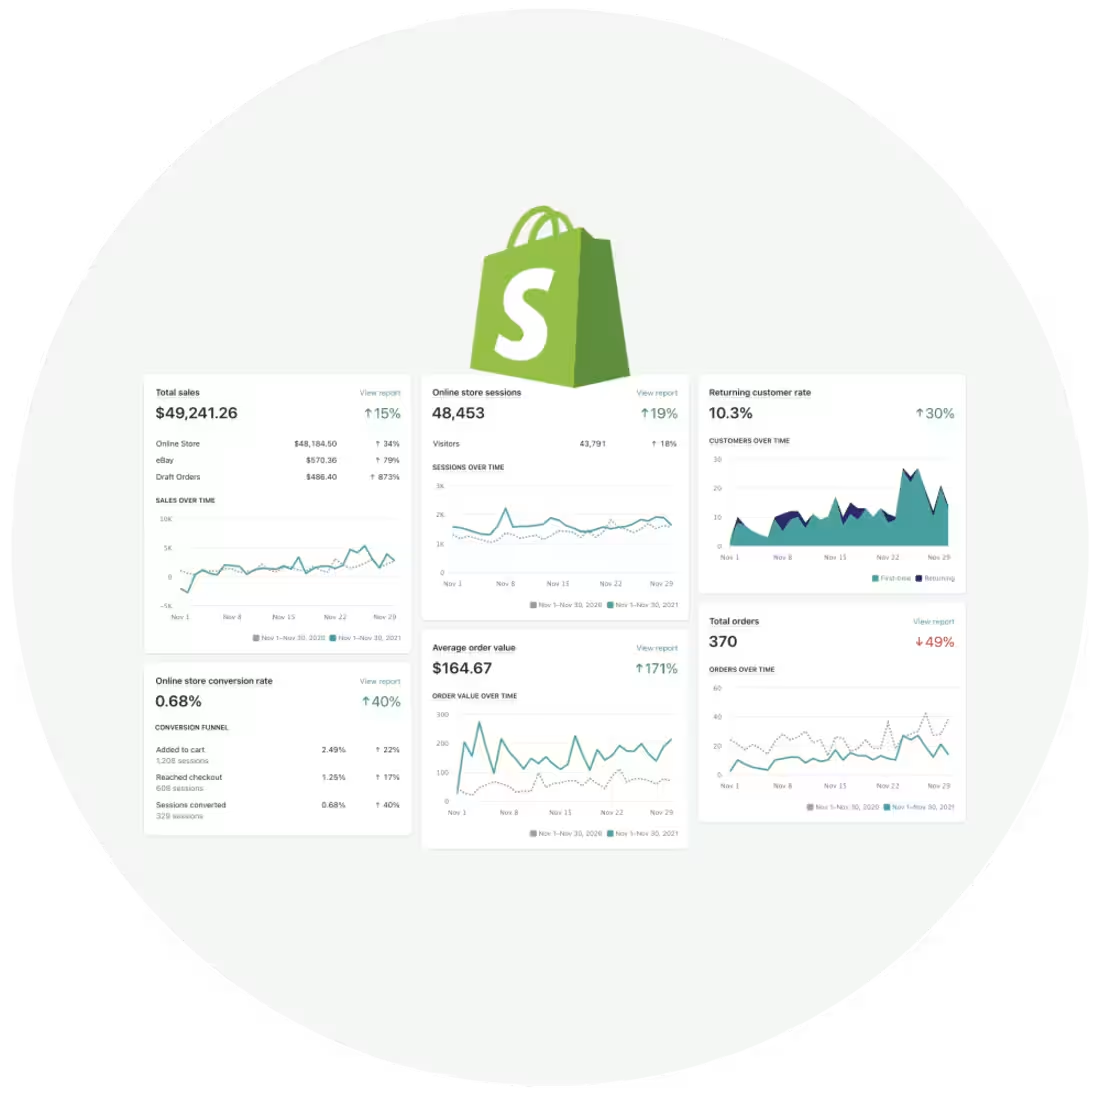
Shopify Performance Dashboard Development
8
318
$5.4K+ earned
Message
3
Erin Riggers
pro
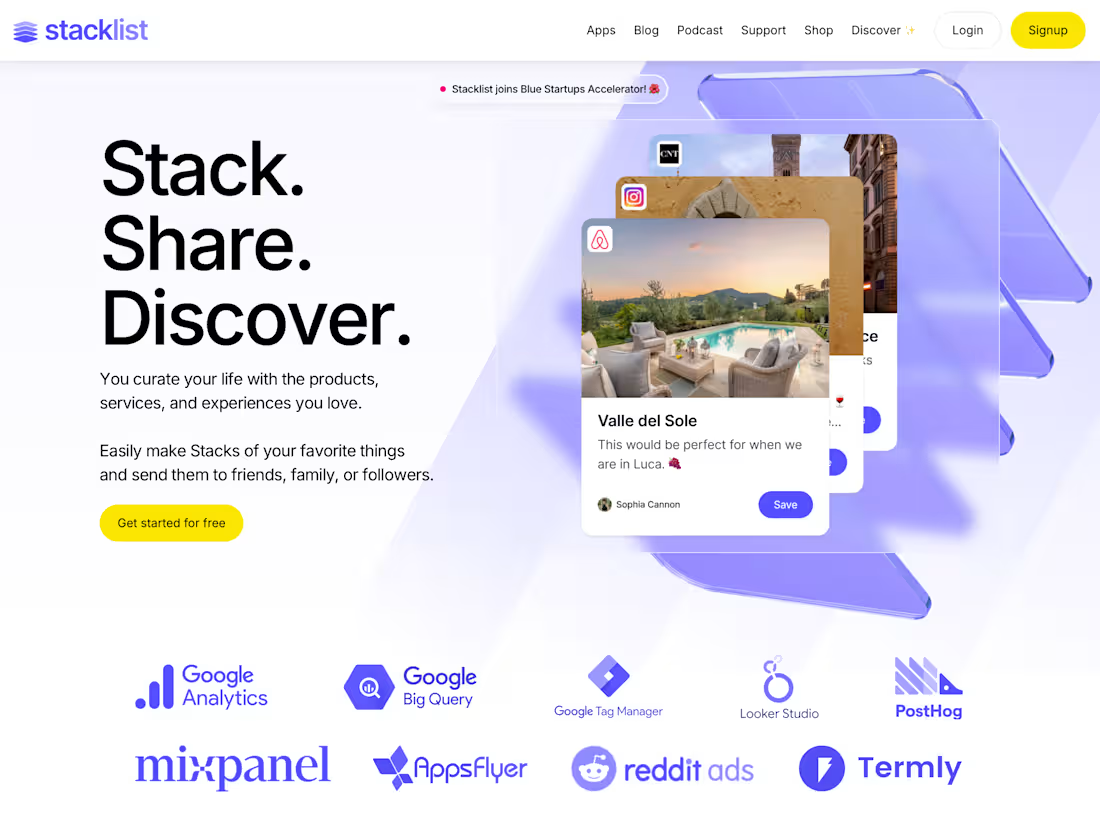
Marketing Stack Audit and Optimization for Stacklist
3
159
Message
0
Uttam Kumaran
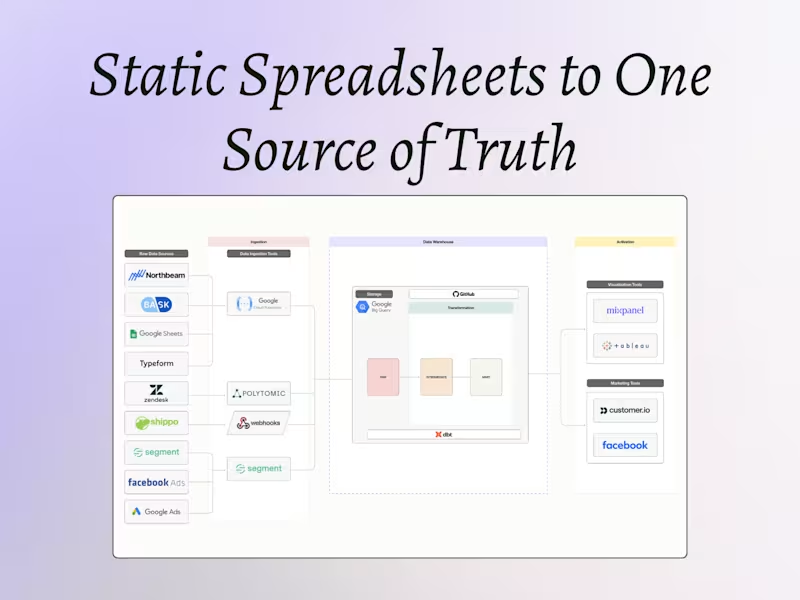
From Brittle Spreadsheets to Real-Time Clarity
0
25
Message
0
Ahmad Taleb
Scaling Fitbod's Fitness App
0
10
Message
1
Jessica Alberton
Cloud cost reduction project - How much does a dashboard cost?
1
19
Message
6
Toolshed (Data, Automation, AI Agents, Buildship, Framer)
max
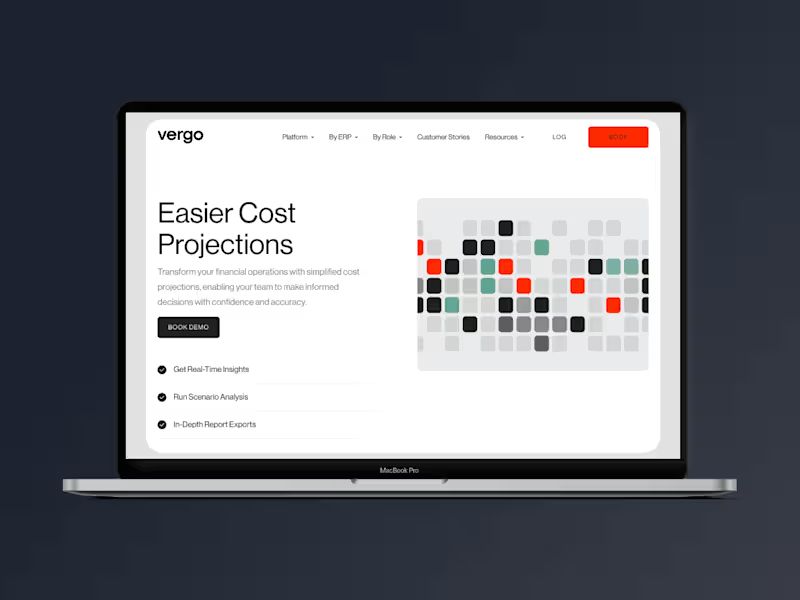
Construction FP&A & Revenue AI Platform
6
312
Message
4
Manuel Navarro
pro
BigQuery Database Creation and Automation
4
152
Message
1
Tayyab Ali
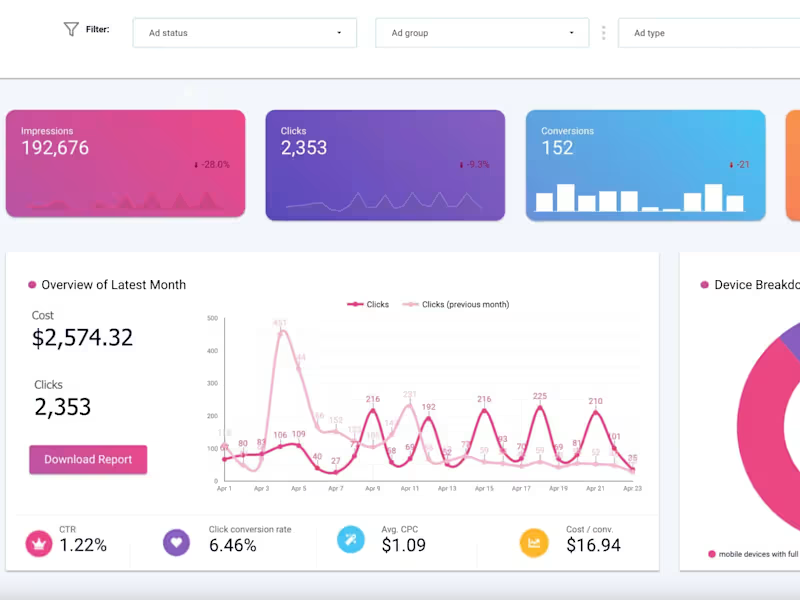
BI Dashboard | Google Analytics | Google Data Studio
1
127
Message
2
Denish Kukadiya
Google Analytics Enhance Data Collection and Reporting
2
30
Message
0
Justin Plagis
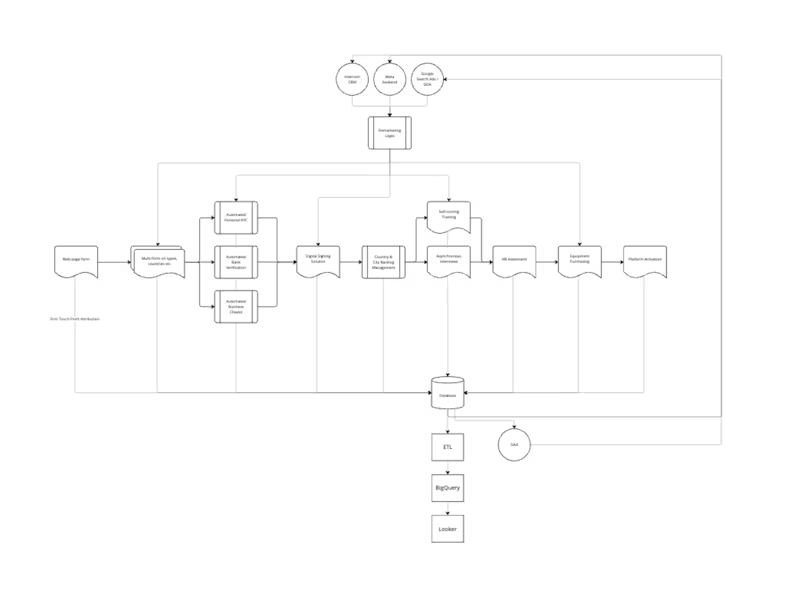
Courier Onboarding & KYC Platform
0
14
Message
1
Hichem Bennaceur
Analytics tracking for Viget agency clients
1
32
Message
1
Taziem Uddin
pro
No More Mondays: $1M+ Traced, Deal by Deal
1
7
Message
4
Prem Patel
pro
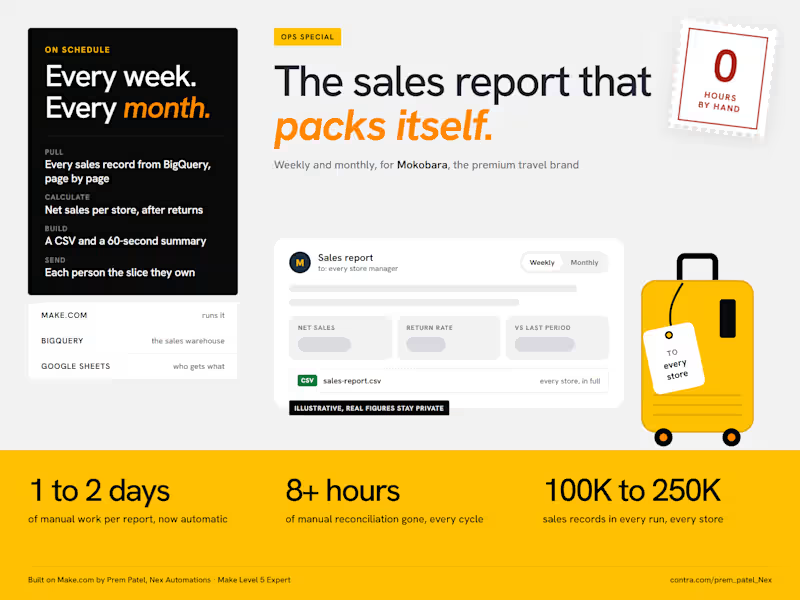
Does someone on your team lose a day or two building the sales report every week or month? That was the starting point at Mokobara, the premium travel brand. Pulling sales across all their stores, checking returns, reconciling the numbers and emailing each manager took 1 to 2 days every cycle, with 8+ hours of that spent just reconciling. I built them an automation on Make.com (http://Make.com) a few months ago. It has run on its own ever since, weekly and monthly: Make pulls every sales record from BigQuery, 100K to 250K per cycle. That is too many for one request, so it reads them page by page and stitches them back together. It calculates the numbers the team actually uses: net sales per store after returns and discounts, return rates and the change against the last period. It builds a CSV with the full breakdown and a short email summary you can read in 60 seconds. It reads a Google Sheet of store representatives and emails every one of them the report for their own store. The result: the reporting problem is gone. The report went from 1 to 2 days of manual work to fully automatic, and the 8+ hours of reconciliation dropped to zero. Two things I would do the same way again: Calculate "net sales" in the automation, not in the warehouse. The business rule for what counts as a net sale is not what the raw data stores. Send people their slice, not the whole report. One report for everyone gets skimmed by everyone. The figures in the image are placeholders, the real ones stay with the client. What report is your team still building by hand? Tell me where the data lives and I will tell you how I would automate it.
4
468
Message
0
Harshil Lakhani
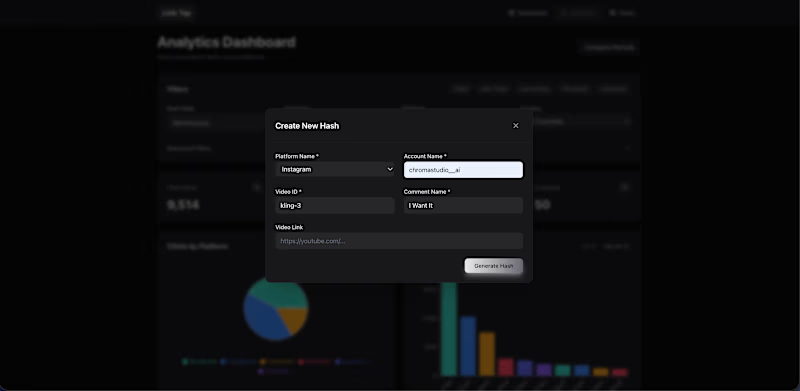
Link_Tap_Track | Social Media Post Analyzer
0
115
Message
1
Varun Sethi
pro
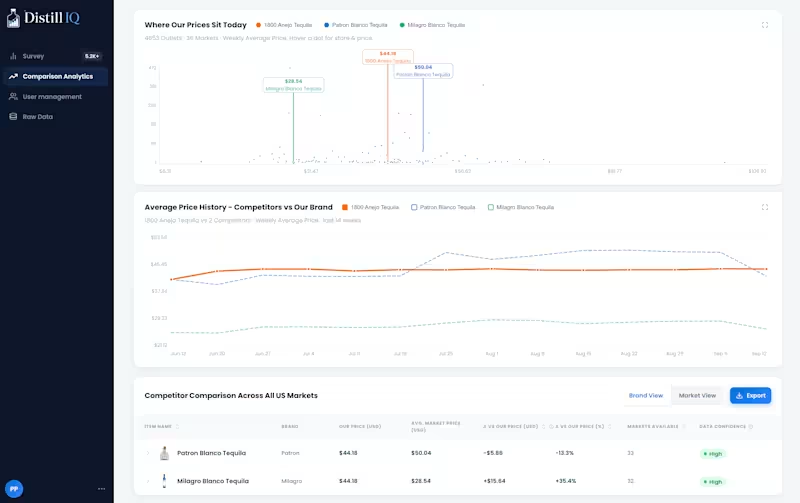
I designed and built Distill IQ, a full-stack retail pricing intelligence platform for a US-based liquor business. The application processes and presents large-scale pricing data through interactive product surveys, competitor comparison analytics, raw data exploration, and user/access management. I worked across the React frontend, Python backend, APIs, BigQuery data layer, business logic, and UI components to build the platform from the ground up. Key features: Pricing Survey: 5,200+ SKUs, 110+ brands, search and advanced filtering Competitor Analytics: Compare products across markets with average, median, mode, price ranges, and price gaps Market Analytics: Interactive price distribution, historical trends, and competitor comparison Raw Data Explorer: BigQuery-backed data exploration with filtering, pagination, and export User Management: User accounts, roles, permissions, market access, and catalog management Reusable UI: Tables, filters, cards, charts, forms, and responsive components
1
123
Message
1
Shubhashish Dixit
pro
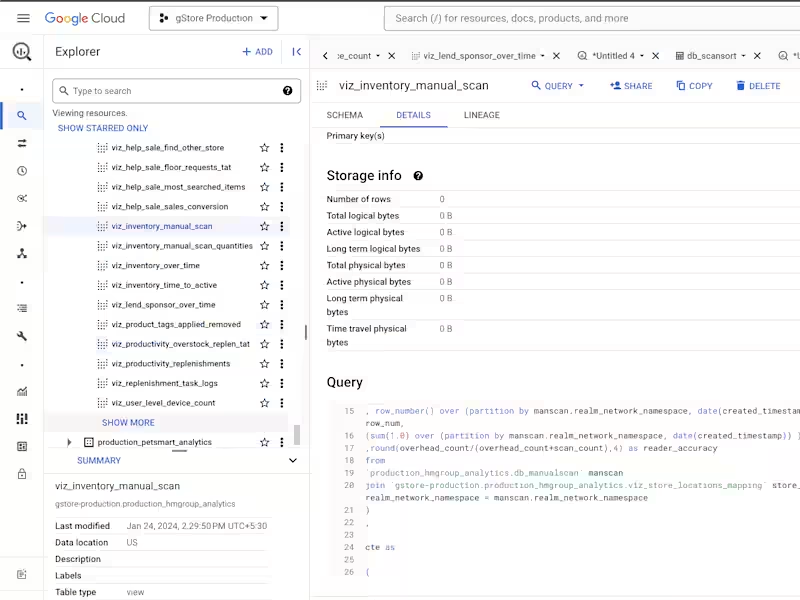
BigQuery Developer
1
45
Explore projects