Graphic designer for brand, print, motion and web
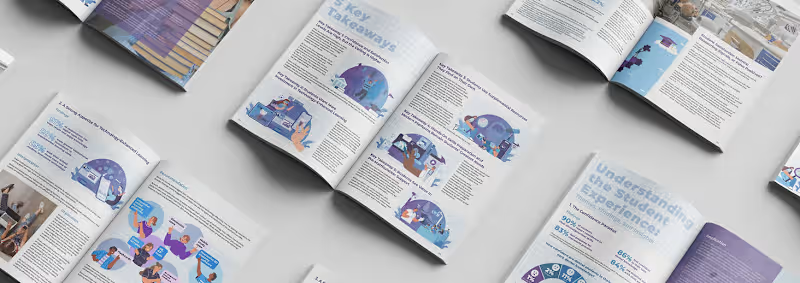

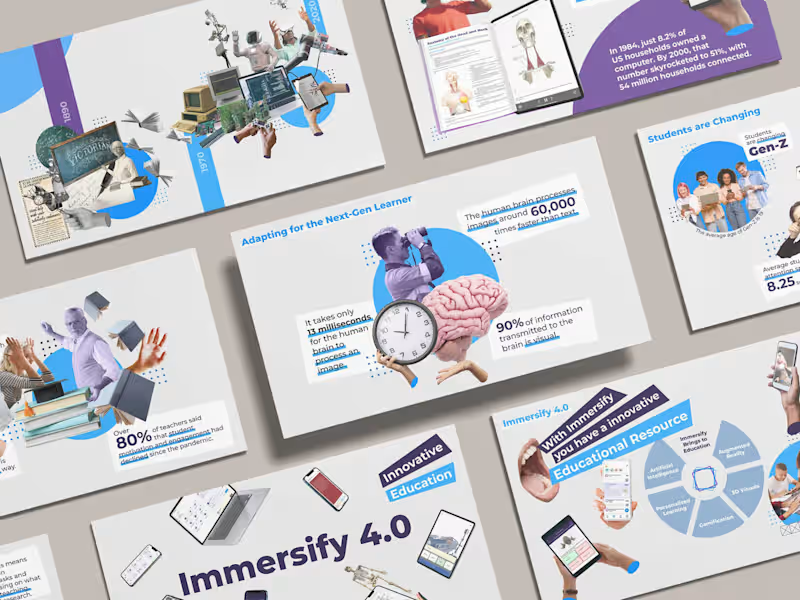
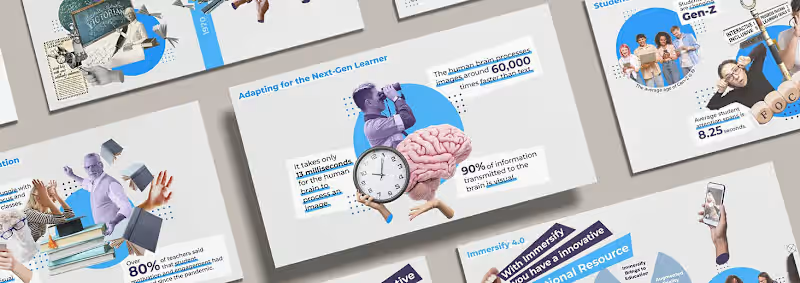
How do you sell new tech to people who’ve taught the same way for years? Show them how far learning has already come.
This pitch deck for Immersify’s Flipped Classroom campaign tells that story in collage, from Victorian lecture halls to interactive 3D, with one clear stat per slide to back it up.
Check it out (https://contra.com/p/keRBsOqY-flipped-classroom-pitch-deck)
0
35

Data Analyst & BI Developer

Superstore Sales & Profitability Dashboard
Interactive Power BI dashboard analyzing 4 years of retail sales data. Includes revenue and profit tracking by region, category, and product, profit margin analysis to identify high-revenue vs high-margin segments, and top/bottom performing product breakdowns. Built to help retail businesses spot where they're making money — not just where they're generating sales.
Tools: Power BI, DAX
1
101

Telco Customer Churn & Revenue Dashboard
Interactive Power BI dashboard analyzing subscription customer data to identify churn drivers and revenue risk. Includes Monthly Recurring Revenue (MRR), Customer Lifetime Value (LTV), and churn rate broken down by contract type, tenure, payment method, and service usage — plus a "Revenue at Risk" metric flagging MRR from high-risk, still-active customers. Built to help subscription businesses understand not just who's leaving, but why.
Tools: Power BI, DAX
1
108


AI/ML Expert: Crafting Intelligent Solutions
AI/ML Expert: Crafting Intelligent Solutions



View more →

Senior Data & Business Intelligence Analyst at Vuhosi
Senior Data & Business Intelligence Analyst at Vuhosi


View more →

Custom Web Designs | Expert in Next.js & Tailwind CSS
Custom Web Designs | Expert in Next.js & Tailwind CSS