Built a high-performance digital marketplace using Vue.js for the frontend and WordPress as a Headless CMS for content management. The platform enables users to explore exclusive deals, coupon codes, and reviews for digital marketing and SaaS tools, delivering a fast, scalable, and SEO-friendly experience with centralized content management.
1
386

Xtreme Vue is a modern Vue.js admin dashboard template built to help developers create scalable web apps faster. It’s designed to cut repetitive setup tasks like routing, layouts, and state management that slow development.
I began with wireframes for the sidebar, header, and widgets, focusing on a clean, responsive layout. Using Vue 3 (Composition API), Pinia, Vite, and Tailwind CSS & more, I built a modular structure with reusable components and consistent styling.
Performance and responsiveness were key. I optimized rendering, added smooth transitions, and tested across devices for a seamless experience.
Deployed on Vercel for speed and reliability, that gives developers a solid base for dashboards, reducing setup time and improving scalability with a sleek, modern UI.
🔗 xtremevue.vercel.app (http://xtremevue.vercel.app)
0
114

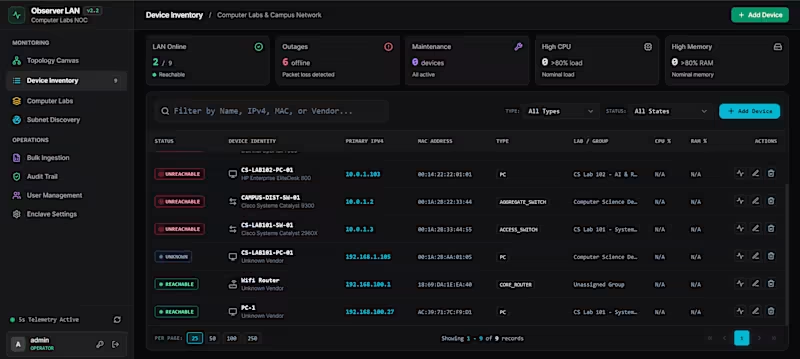
Network Observer: Air-Gapped Enterprise LAN Telemetry & Topology Engine
Executive Summary
Network Observer is a self-hosted, sovereign network telemetry and topology visualization suite engineered for air-gapped university campus labs and secure enterprise subnets. Designed from the ground up for zero external cloud dependencies, it delivers real-time device health monitoring, automated subnet discovery, hierarchical computer lab grouping, and interactive DAG network graphs with an ultra-lean memory footprint (< 500 MB RAM).
The Challenge
Educational institutions and secure facilities manage hundreds of lab machines, routers, and managed switches distributed across segmented VLANs. Existing solutions were either:
Cloud-Tethered SaaS: Violating data residency constraints and failing entirely in air-gapped environments.
Resource-Heavy Legacy Tools: Bloated platforms consuming tens of gigabytes of RAM with outdated, clunky interfaces.
Disconnected Tooling: Requiring separate software for ping sweeps, topology mapping, and asset inventory.
The goal was to build a modern, unified, tactical NOC command center that operates entirely offline, boots in seconds, and handles live telemetry without straining hardware.
Engineering & Architectural Philosophy
As the Lead Architect, I directed the end-to-end technical requirements, database schemas, API contracts, and UX patterns, leveraging state-of-the-art AI pair-programming workflows to rapidly execute and harden production code across the full stack.
Strict 4-Tier Clean Architecture: Domain, Application, Infrastructure, and Presentation layers ensuring complete testability and separation of concerns.
Zero Raw SQL Overhead: Strongly-typed EF Core 10 LINQ queries coupled with a relational PostgreSQL 18 backend running sub-millisecond query execution.
Deterministic Resource Budgeting: Engineered with an explicit ceiling under 500 MB RAM across both Kestrel backend and the frontend runtime.
Comprehensive Automated Verification: 151 automated integration and unit tests covering domain invariant rules, ICMP probes, and RBAC authentication.
Key Features & Innovations
1. Interactive Cytoscape.js Topology Canvas
Real-time network mapping with dynamic layout toggling: Lab Hierarchies (Core Router → Aggregate Switch → Computer Lab Groups → Workstations) or Pure Device-to-Device.
High-performance SVG nodes styled with tactical cyber-optic color palettes, transparent glyph backgrounds, and auto-wrapping status badges.
Hardware-accelerated cursor-anchored smooth zooming and collision-avoidance Dagre layouting.
2. Live Telemetry & Slide-Over Inspector Drawer
Background non-blocking worker threads conducting periodic ICMP/SNMP telemetry sweeps every 5 seconds.
Instant slide-over inspection drawer displaying live CPU/RAM utilization metrics, uptime gauges, IP/MAC bindings, and vendor footprints.
Route-aware state management that collapses drawers seamlessly upon switching views.
3. Subnet Sweep Discovery & Staging Pipeline
Parallelized CIDR sweep engine (e.g., 192.168.1.0/24) capable of identifying active hosts and resolving MAC/vendor footprints in seconds.
One-click staging pipeline allowing discovered network hosts to be audited and promoted directly into production inventory.
4. Role-Based Governance & Audit Trail
Air-gapped JWT token authentication paired with cryptographically secure PBKDF2 passphrase hashing.
Immutable append-only audit trail logging every device provisioning, IP reassignment, and status mutation.
Technology Stack
Backend: C# .NET 10 Kestrel Web API, Entity Framework Core 10
Database: PostgreSQL 18 with relational integrity constraints & indexing
Frontend: Vue 3 (Composition API), TypeScript, Vite, Pinia Store
Canvas Visualization: Cytoscape.js with Dagre Hierarchical Layout Engine
Styling: Tailwind CSS, Lucide Icons, Custom Tactical NOC Theme
DevOps & Quality: GitHub Actions CI/CD Pipeline, xUnit, FluentAssertions (151 passing tests)
Key Metrics & Results
100% Air-Gapped Sovereign: Zero external telemetry pings or telemetry leakage.
< 500 MB Total Memory Ceiling: Runs seamlessly on resource-constrained campus edge servers.
151/151 Test Coverage: Zero test regressions with automated GitHub Actions verification.
Sub-Millisecond Queries: Fast relational indexing across hundreds of concurrent lab nodes.
0
42



A high-performance time-tracking and productivity suite designed for remote team transparency. It automates the gap between "time logged" and "work done" using real-time surveillance and intelligence reporting.
Core Features:
Live Monitoring: Real-time screen streaming and automated screenshots every minute.
Precision Tracking: One-click task-based timers with automated daily timesheets.
Productivity Intelligence: AI-driven reports to identify bottlenecks and resource leaks.
Activity Verification: Daily work videos to review team progress at a glance.
Multi-OS Support: Native desktop clients for Windows, Mac, and Linux.
Tech Stack:
Backend: Laravel (PHP), Python (for automation/data processing).
Frontend: Vue.js / Fabric.js (for real-time dashboard and design elements).
Cloud & Storage: AWS S3 (for high-frequency screenshot/video storage).
Architecture: Scalable data pipelines for real-time reporting and 300 DPI server-side exports.
1
203