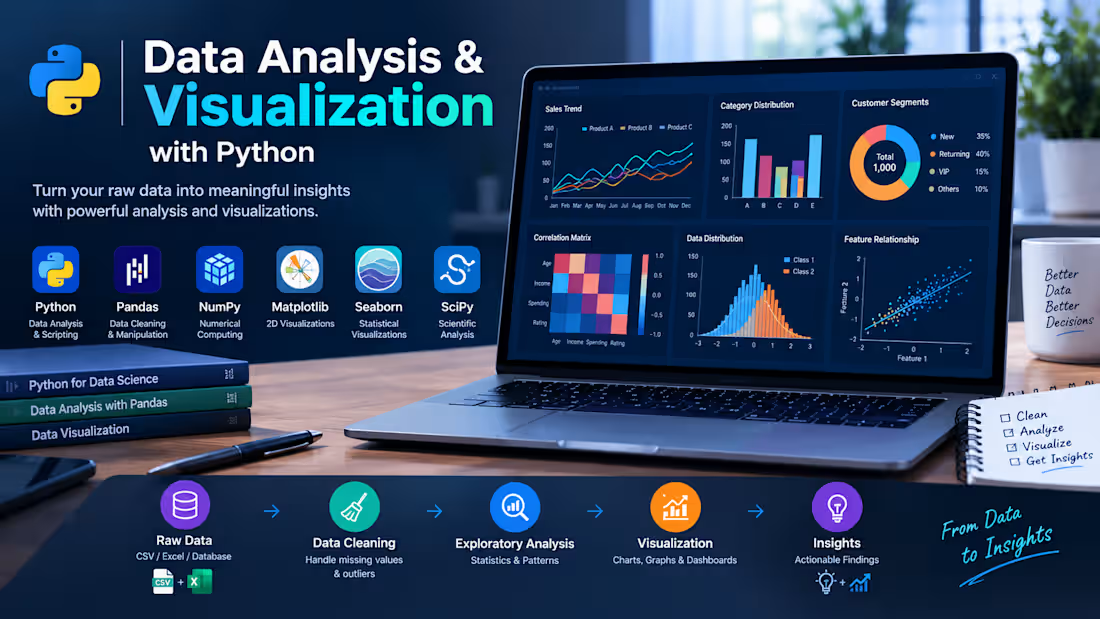
Data Analysis & Visualization with Python: Developed a Python-based data analysis workflow to transform raw datasets into meaningful insights through data cleaning, exploratory data analysis (EDA), statistical analysis, and visualization.
The workflow uses Python's data science libraries to organize datasets, identify patterns and trends, examine relationships between variables, and present findings through clear, informative charts and graphs. The goal is to make complex data easier to understand and support data-driven decision-making.
Key Features:
Data Cleaning & Preprocessing: Handle missing values, inconsistent entries, and data quality issues.
Exploratory Data Analysis: Investigate distributions, patterns, trends, and relationships within datasets.
Statistical Analysis: Calculate descriptive statistics and analyze correlations between variables.
Data Visualization: Create informative charts, graphs, and plots to communicate analytical findings.
Insight Generation: Summarize key observations in a clear and understandable format.
Reproducible Workflow: Use Python scripts and notebooks for transparent, repeatable analysis.
Technologies Used: Python · Pandas · NumPy · Matplotlib · Seaborn · SciPy
0
20


Analyzed e-commerce sales data to identify revenue, profitability, product, category, and regional performance patterns. The project includes data cleaning, exploratory data analysis, KPI analysis, trend identification, and interactive visualizations to support data-driven business decisions. Built the analysis using Python, Pandas, NumPy, Matplotlib, and Seaborn, with a focus on translating raw sales data into actionable business insights.
0
43
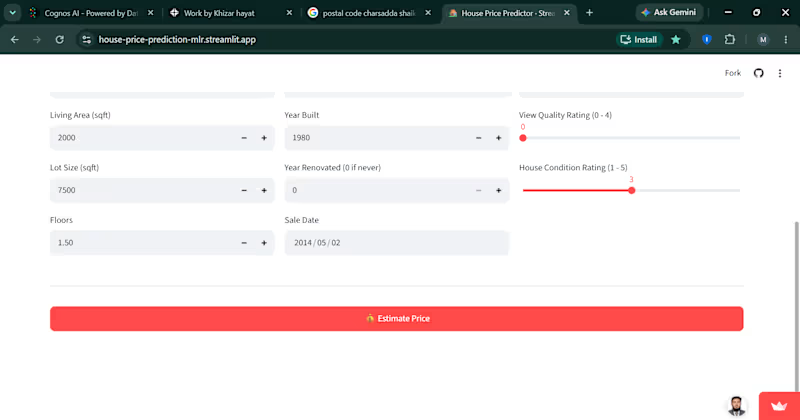


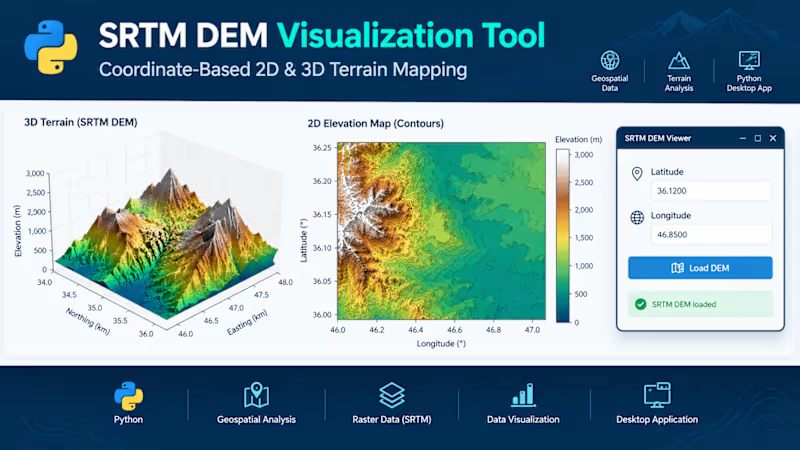
SRTM DEM Visualization Tool – Python Desktop Application
Developed a Python-based desktop application for visualizing Shuttle Radar Topography Mission (SRTM) Digital Elevation Model (DEM) data. The application allows users to enter geographic coordinates (latitude and longitude), load the corresponding elevation data, and explore terrain through interactive 2D and 3D visualizations.
The tool presents a 3D terrain surface to examine landscape features and a 2D elevation map with contour details and elevation-based color mapping. It combines geospatial data processing, raster analysis, and scientific visualization within a user-friendly graphical interface.
Key Features:
- Coordinate-based terrain data selection
- 2D elevation mapping and contour visualization
- 3D terrain surface plotting
- Elevation-based color mapping
- Desktop GUI for convenient data exploration
Technologies: Python, SRTM DEM, geospatial data processing, Matplotlib, 2D/3D visualization, and GUI development.
0
23

