Machine Learning Engineering Projects in PunjabMachine Learning Engineering Projects in PunjabHello Contra Fam!👋🌍
I'm Zeba — a girl who loves travelling, exploring new places, and getting lost in new cultures. ✈️
But I'm also someone who builds AI systems for a living — and somewhere between my love for travel and my passion for technology, something really exciting happened.
I started building AI tools for travelers. 🤖
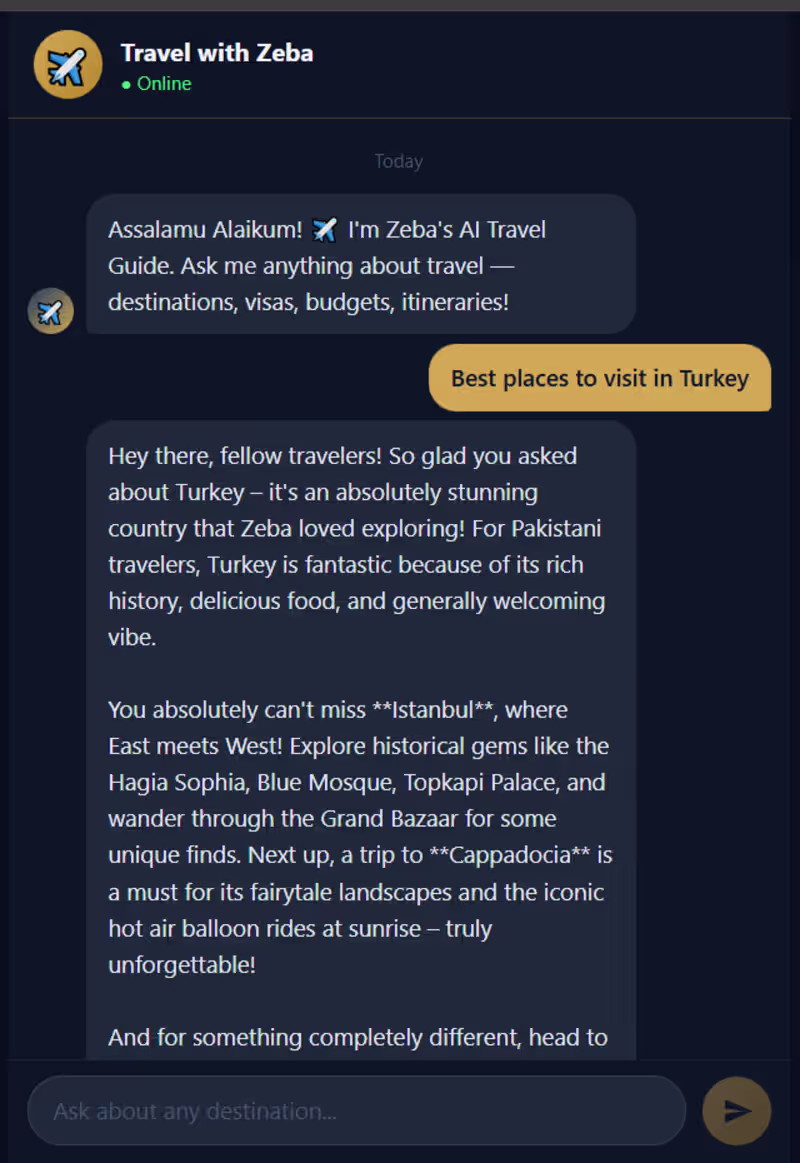
My first one? A live AI travel chatbot that plans your entire trip — destinations, visas, budgets, itineraries — all in one place.
No more hours of Googling. Just ask, and it answers. 💬
👉 https://travelwithzeba.vercel.app/
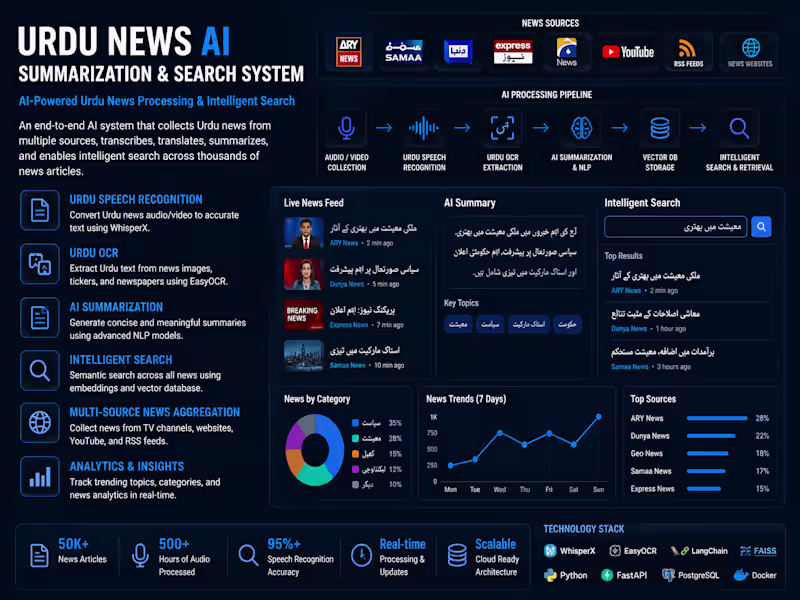
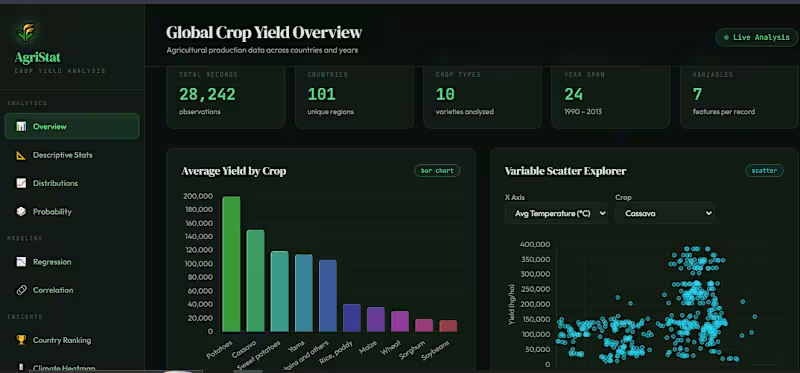
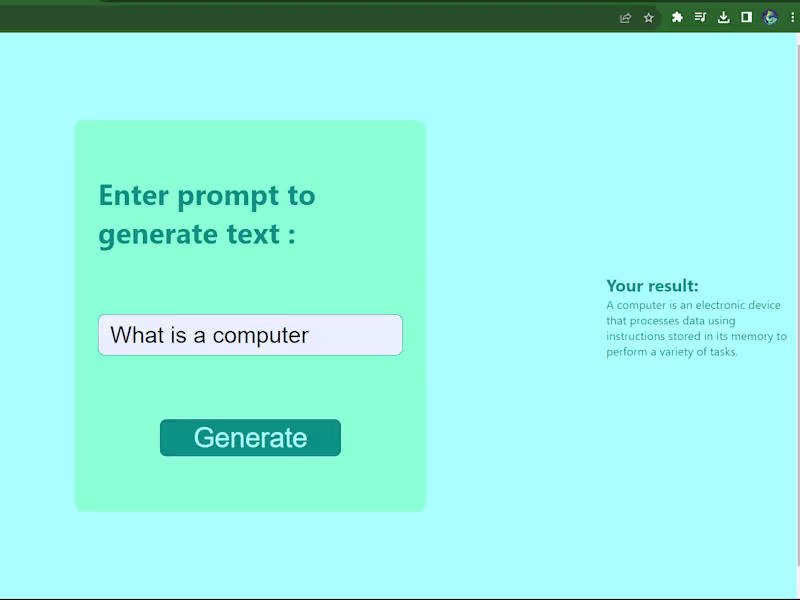
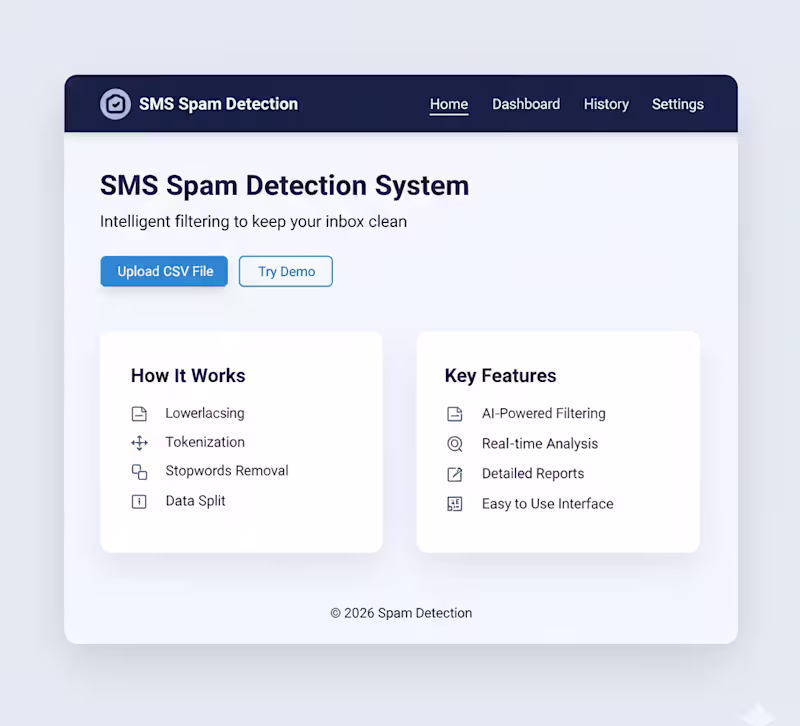
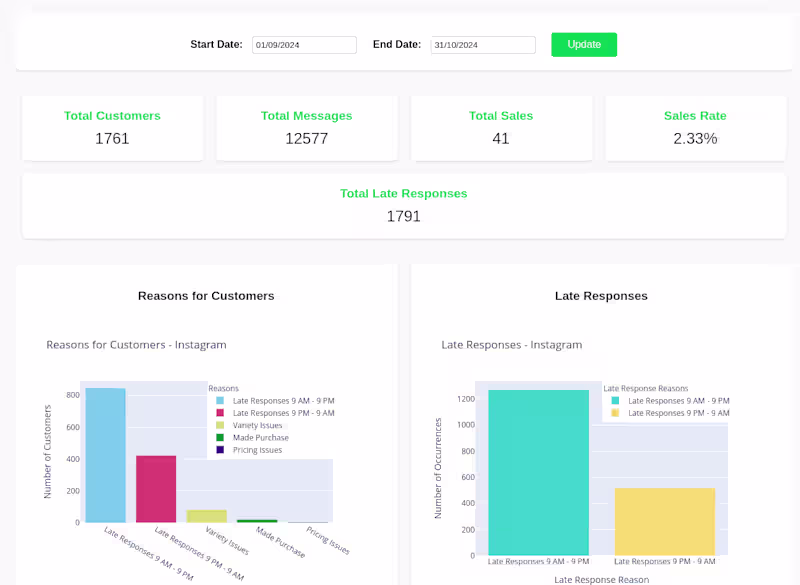
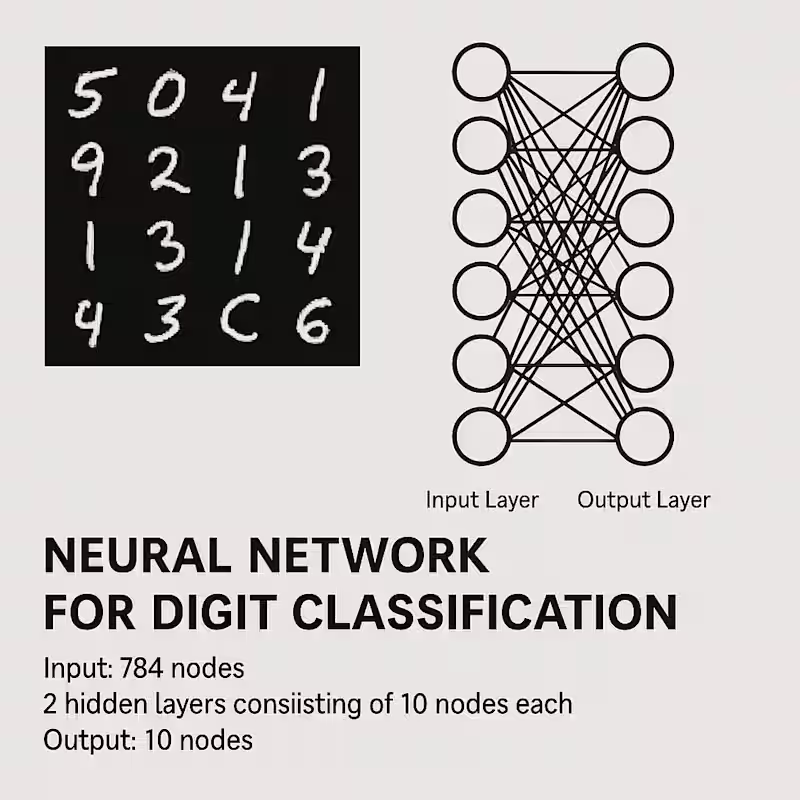
This is my first post here and honestly just the beginning — I have a lot more coming. Travel AI, data dashboards, NLP projects — all built with love and a lot of Python. 🐍
If you love travel, data, or just cool AI stuff — stick around! 🙌
🔗 GitHub: https://github.com/Zeba-Mushtaq/-travel-with-zeba-chatbot