Results that are similar to your search
Similar results
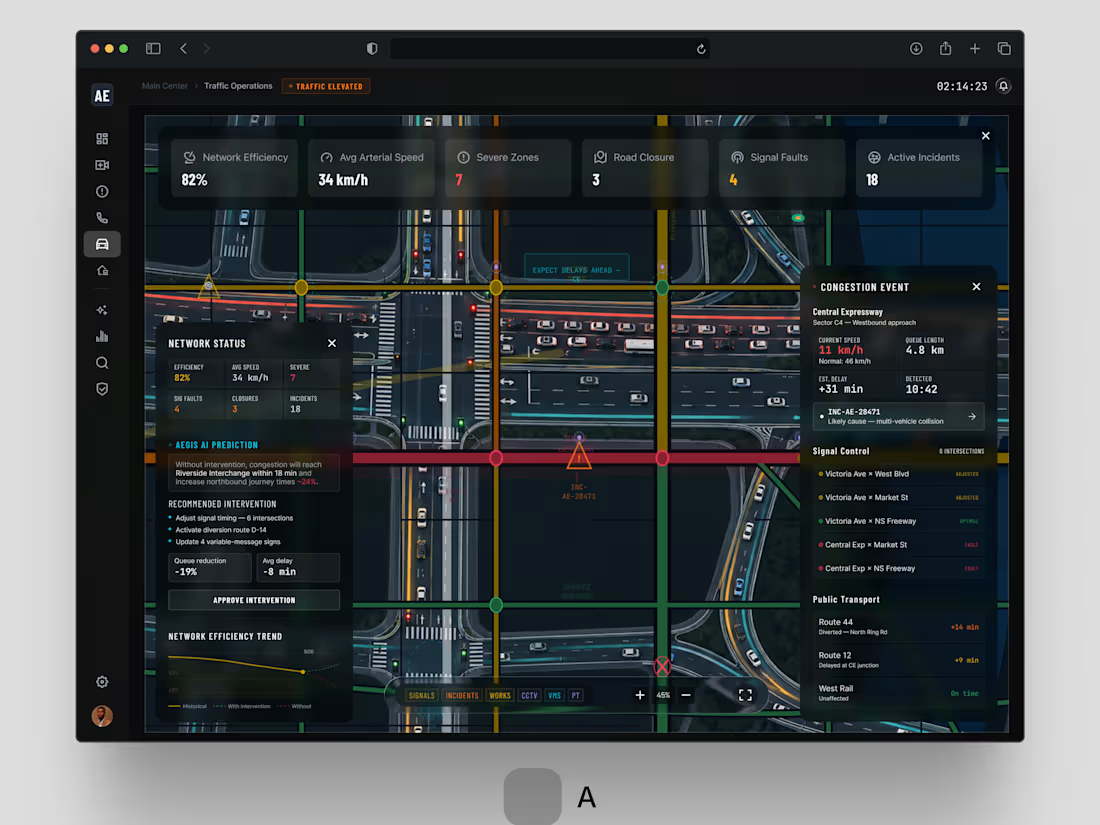
One problem. Two design directions. Which would you choose?
For AEGIS / 001.05 . Traffic Operations, we explored two approaches to the same challenge: helping city operators understand congestion, incidents and network-wide disruptions without overwhelming them with information.
Both solve the same operational problem. Different approaches to hierarchy and interaction.
If you were behind the control desk . Option A or Option B?
#smartcities #enterpriseux #productdesign #digitaltransformation #jemirae
8
5
926




YOU SHOULDN'T HAVE TO SPEND HOURS COLLECTING DATA JUST TO UNDERSTAND YOUR BUSINESS PERFORMANCE.
Many businesses collect information from different sources.
For example:
Sales records are stored in one application.
Customer information is stored in a CRM.
Expenses are tracked in spreadsheets.
Website performance is monitored separately.
The challenge is bringing all this information together.
This is where automated reporting becomes useful.
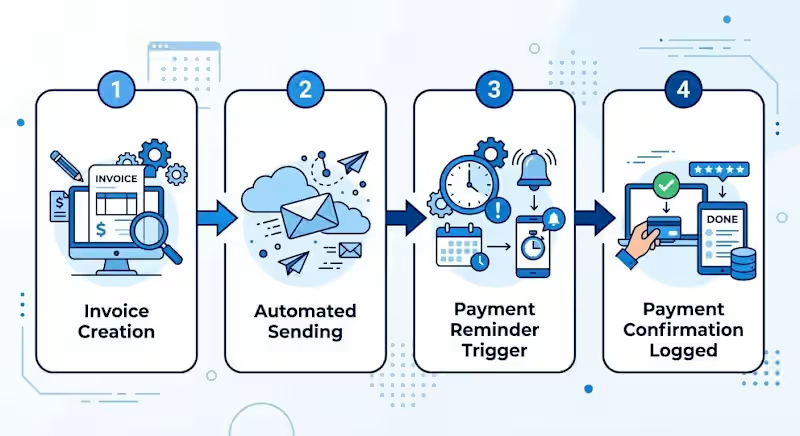
Imagine this workflow:
Your sales platform records new transactions.
Your expense spreadsheet receives updated information.
Your CRM tracks customer activity.
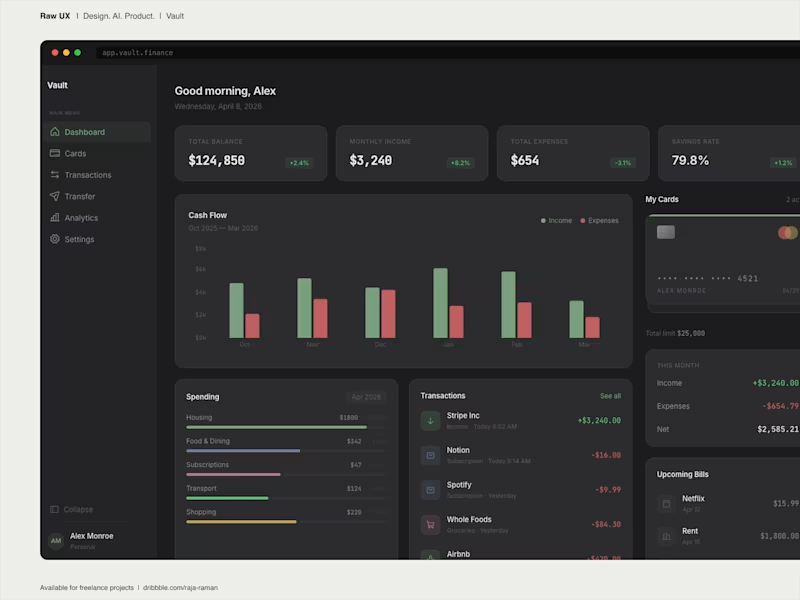
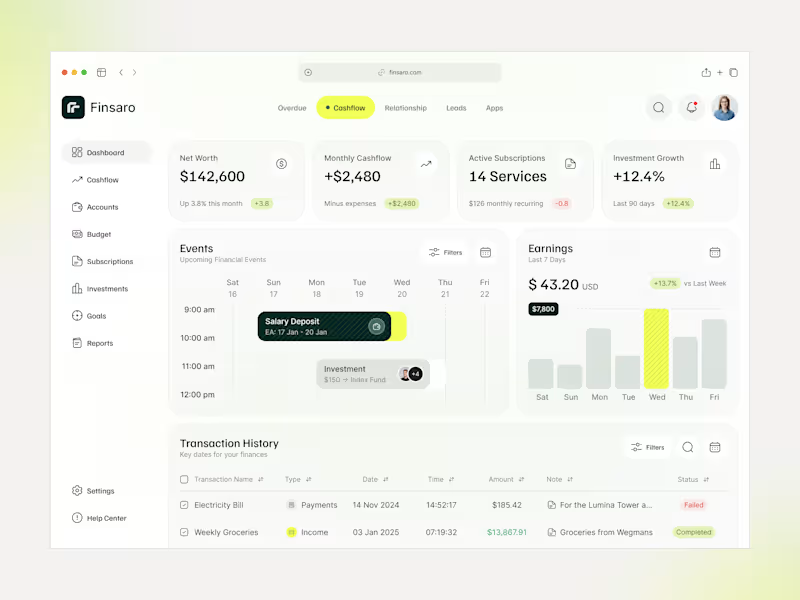
Data is connected to a reporting dashboard.
Your dashboard displays updated business information.
Instead of manually compiling different reports every time, you can create a system that organizes important information in one place.
What can an automated dashboard help you monitor?
📊 Sales performance.
📊 Customer acquisition.
📊 Business expenses.
📊 Lead conversion.
📊 Team productivity.
Tools such as Google Sheets, Excel, Power BI, and automation platforms can help create connected reporting systems.
Remember: Data is valuable, but organized and accessible data is even more useful when making business decisions.
What business metric would you most like to monitor from one dashboard?
#DataAutomation #BusinessAutomation
0
20