Data Science Projects in PakistanData Science Projects in PakistanEnd-to-End Telco Customer Churn Prediction System
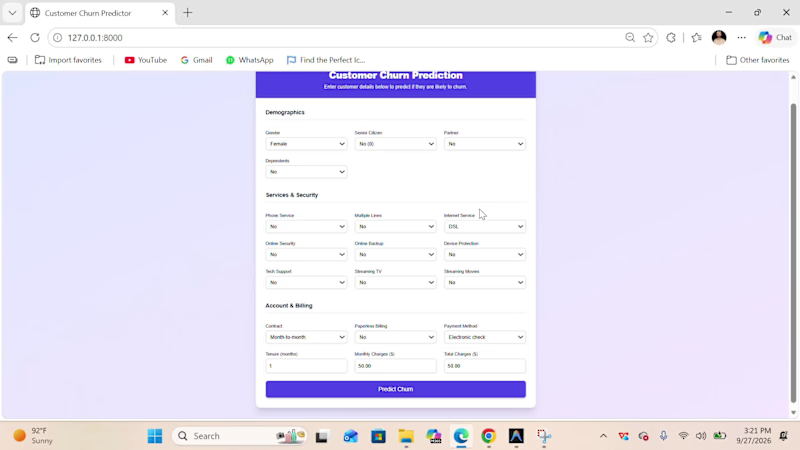
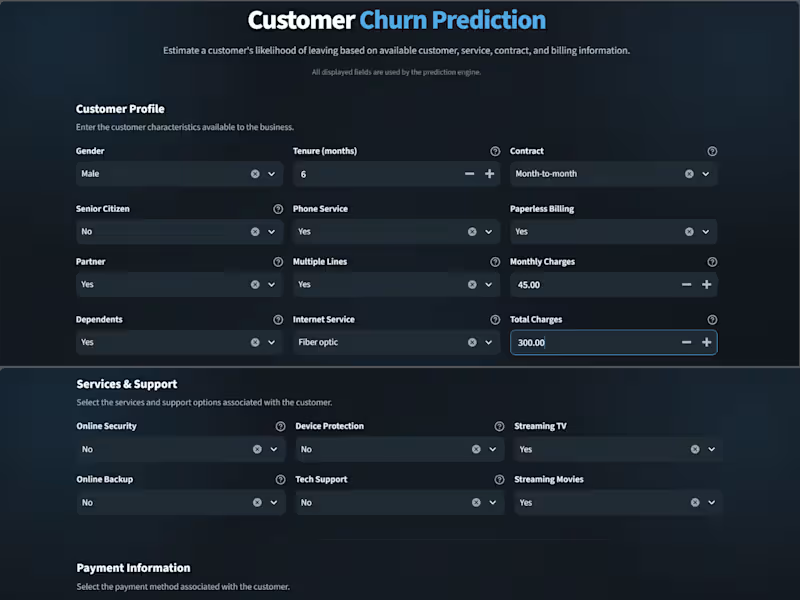
Developed and deployed a production-grade Machine Learning web application designed to predict telecom customer churn and identify key drivers of customer attrition. This project bridges the gap between data science research and real-world deployment by transforming a Jupyter Notebook workflow into an interactive, cloud-hosted web service.
Key Technical Highlights & Workflow:
Exploratory Data Analysis & Preprocessing: Conducted thorough EDA on customer behavioral data, handled missing values, encoded categorical features, and performed feature scaling to ensure robust model performance.
Model Training & Hyperparameter Tuning: Trained multiple machine learning algorithms (including Random Forest, XGBoost, and Logistic Regression) and optimized hyperparameters to achieve high predictive accuracy and generalization.
Model Explainability (SHAP): Integrated SHAP (SHapley Additive exPlanations) values to make complex model predictions transparent, helping stakeholders easily interpret feature impacts (such as tenure, monthly charges, and contract types) on individual predictions.
Backend & API Architecture: Built a high-performance RESTful API using FastAPI to handle real-time inference requests seamlessly, coupled with a clean, responsive frontend user interface.
Cloud Deployment & DevOps: Successfully packaged the application and trained model (.pkl), navigated serverless deployment constraints by leveraging container-based cloud infrastructure (Render), and ensured continuous availability.
Tech Stack:
Python, Scikit-Learn, XGBoost, Pandas, NumPy, FastAPI, Uvicorn, SHAP, HTML/CSS, Git, Render. Built a machine learning web app that predicts customer churn risk from customer, service, contract, and billing data. The project includes data preprocessing, model training, evaluation, and a Streamlit interface for interactive predictions. Developed with Python, Pandas, NumPy, Scikit-learn, Joblib, and Streamlit. Spotify Analysis Dashboard
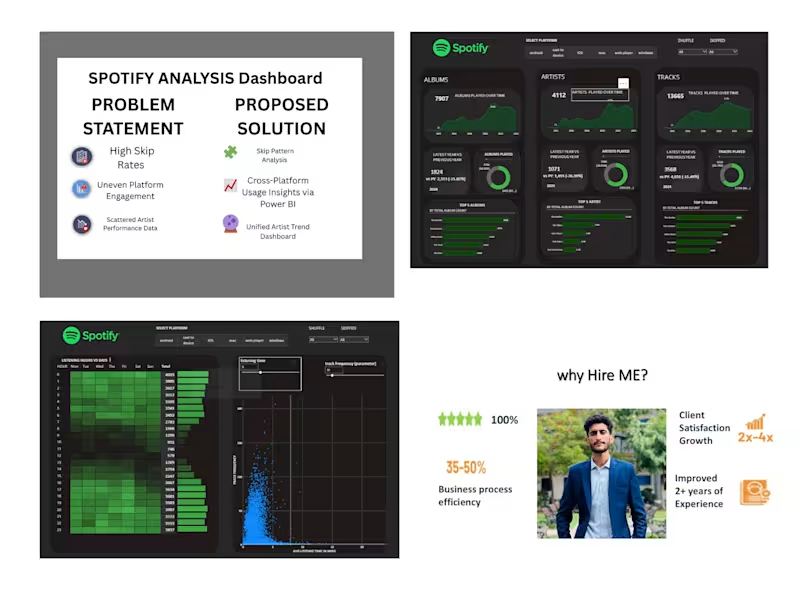
Turned raw Spotify streaming data into a clear, interactive dashboard that reveals how listeners actually engage with music.
Built in Power BI using SQL and DAX, this project explores user behavior across devices, identifies skip patterns, and highlights top-performing artists and tracks.
With dynamic visuals powered by key metrics like reason_start, reason_end, platform, and ms_played, the dashboard uncovers:
• Why users skip songs or stop playback
• Which platforms drive the most engagement
• Which artists and albums perform best by time and device
Perfect for music analysts, record labels, or streaming teams who want actionable insights into listener habits and engagement trends.