Projects using Matplotlib in OlivosProjects using Matplotlib in OlivosAward season meets analytics — and it all comes to a head this Sunday, January 11, when the Golden Globes 2026 ceremony takes place in Los Angeles.
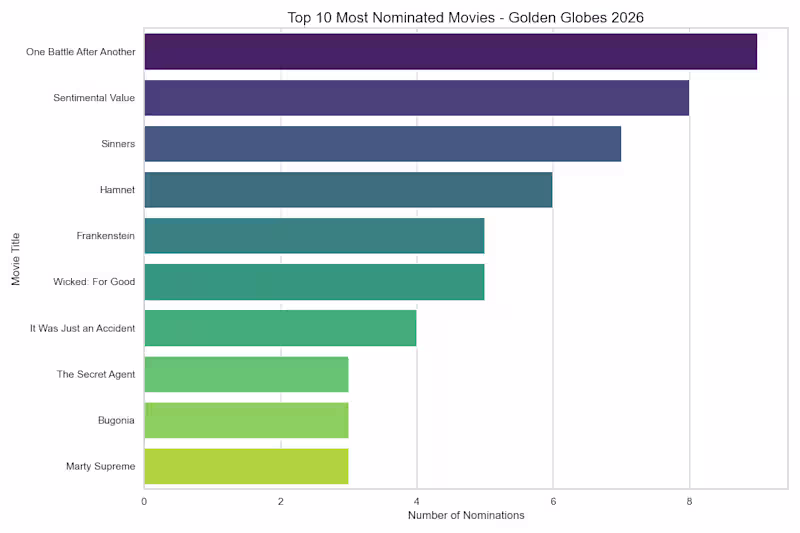
To celebrate, I built a full-stack data project exploring the 2026 Golden Globes movie nominations, starting with a custom CSV dataset featuring:
🎬 Movie, Director, Genre, Nominations
🍅 Tomatometer, 🍿 Popcornmeter, Metascore Approval & User Score
From there, I created:
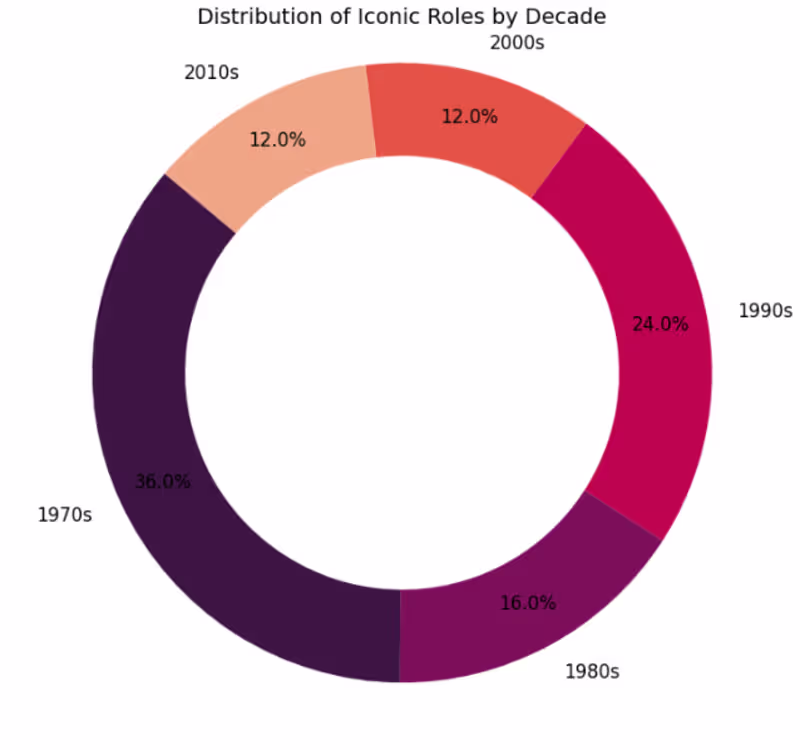
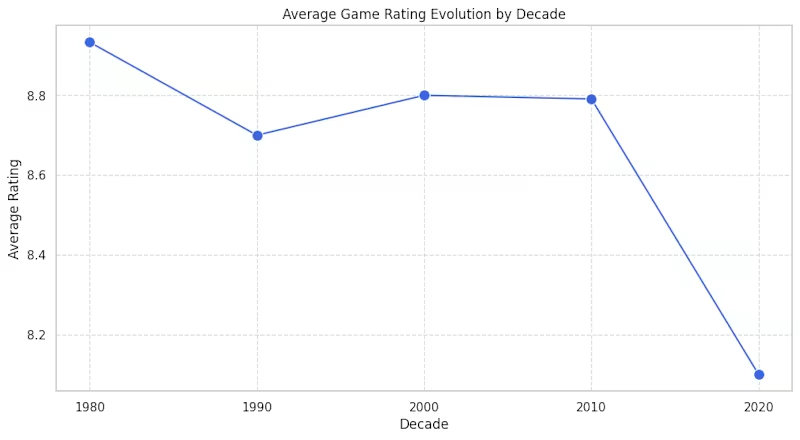
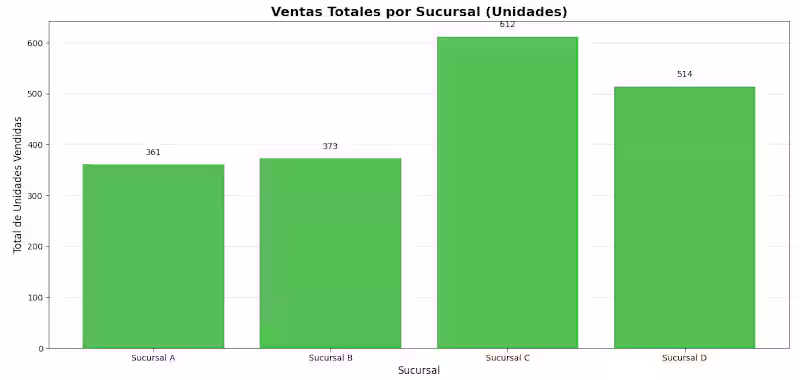
📊 Python visualizations with Matplotlib & Seaborn
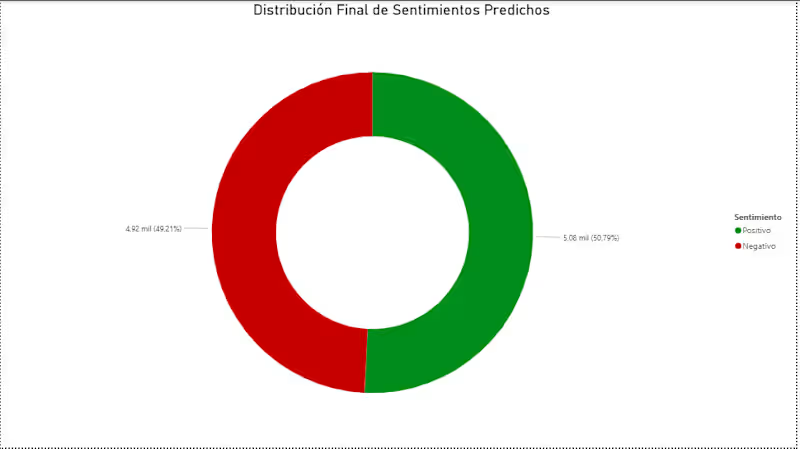
🍩 Power BI Donut Charts showing genre distribution and metascore approval
This project combines technical depth with cultural relevance, showing how data can illuminate trends in film recognition and audience reception.
Read my Article on Medium ➡️ Article (https://medium.com/@ciroduro01/golden-globes-2026-a-data-driven-look-at-the-movie-nominations-8df7a40e84b1)