Projects using Tableau in Nairobi CountyProjects using Tableau in Nairobi County🚀 UK Banking Dashboard | Advanced Financial Analytics by Intersect Analytics
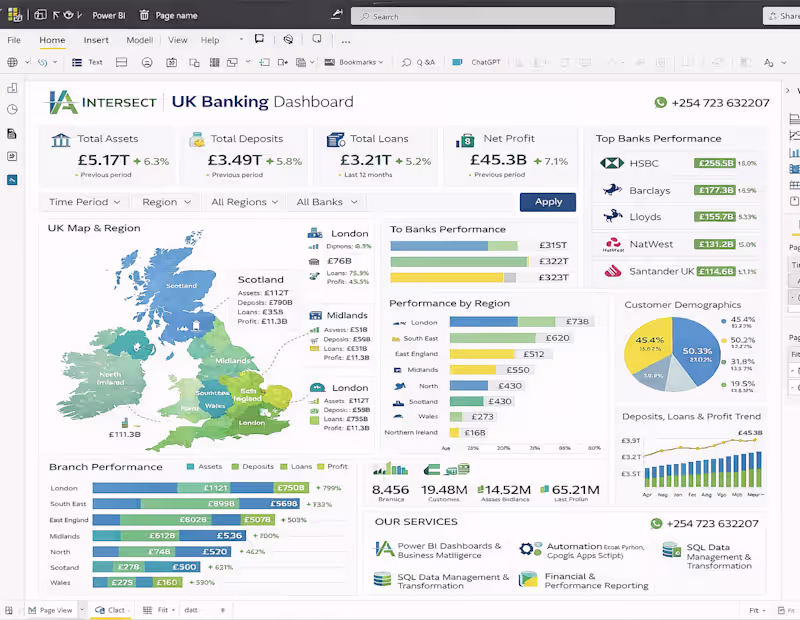
Unlock the full potential of your financial data with our Power BI–driven UK Banking Dashboard, designed to deliver real-time insights, performance tracking, and data-driven decision-making for financial institutions and analysts.
📊 Comprehensive Banking Performance Insights
Our dashboard provides a 360° view of the UK financial sector, covering:
✔ Total Assets, Deposits, Loans & Profitability
✔ Top Bank Performance (HSBC, Barclays, Lloyds, NatWest, Santander)
✔ Regional Performance Analysis (London, Midlands, Scotland & more)
✔ Customer Demographics & Behavior Insights
✔ Branch-Level Performance Tracking
✔ Trends in Deposits, Loans & Profit Growth
With interactive filters (Time Period, Region, Bank), users can drill down into specific insights instantly.
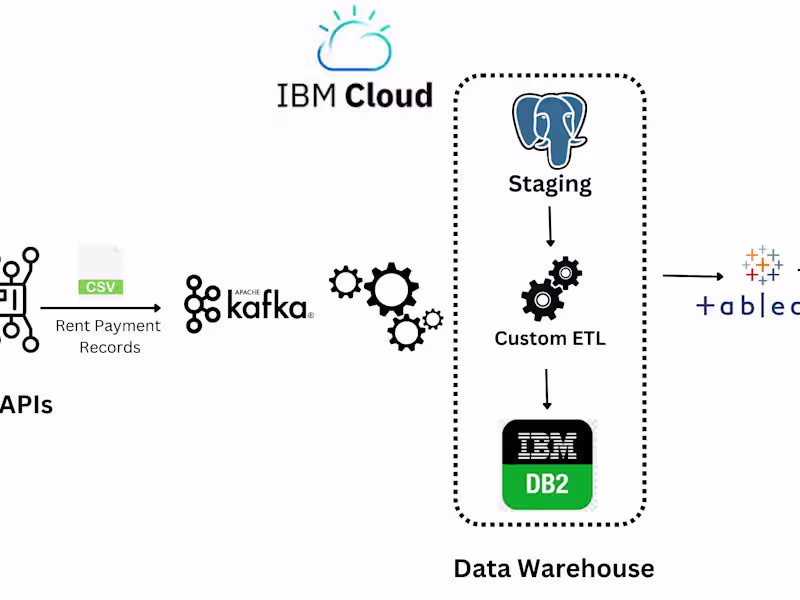
⚙️ Built with Industry-Leading Tools
This solution is powered by:
📊 Power BI – Interactive dashboards & advanced visual analytics
🗄️ SQL – Data extraction, transformation & modeling
🐍 Python – Automation & advanced data processing
📈 Excel – Financial modeling & reporting
💼 Our Core Services
At Intersect Analytics, we deliver end-to-end data solutions:
🔹 Business Intelligence Dashboards (Power BI & Tableau)
🔹 Data Cleaning, Transformation & Modeling
🔹 Automation (Excel, Python, Google Apps Script)
🔹 SQL Database Management & Optimization
🔹 Financial & Operational Reporting
🎯 Why Choose Intersect Analytics?
✔ Data-first approach – Clean, structured, and reliable data foundation
✔ Custom-built solutions – Tailored to your business needs
✔ Advanced analytics expertise – Finance + Data combined
✔ Actionable insights – Not just dashboards, but real business value
✔ Professional, scalable delivery
📈 Business Impact
🚀 Improve financial visibility and reporting accuracy
📊 Make faster, data-driven decisions
💰 Identify growth opportunities and optimize profitability
🔍 Gain deeper insights into customers and regional performance
📩 Get Started Today
Ready to transform your financial data into powerful insights?
📞 +254 723 632207 (WhatsApp Available)
📍 Intersect Analytics
💡 Intersect Analytics — Turning complex data into clear financial intelligence. 🚀 HR Analytics Dashboard – Case Study by Intersect Analytics
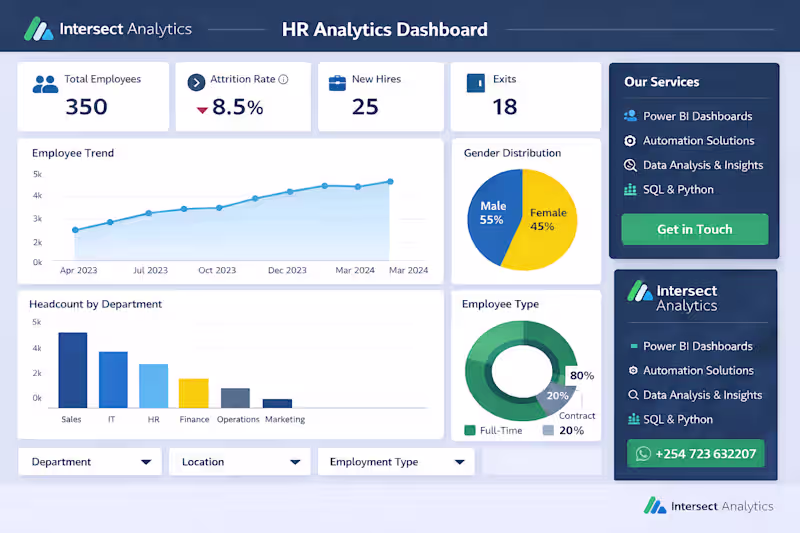
We recently developed a professional HR Analytics Dashboard designed to help organizations gain full visibility into their workforce and make smarter, data-driven HR decisions.
🔍 The Challenge
Many organizations struggle with scattered HR data, manual reporting, and limited insights into employee performance, attrition, and hiring trends.
💡 Our Solution
At Intersect Analytics, we built a centralized Power BI dashboard that delivers:
• Real-time visibility into employee headcount, attrition, and hiring
• Clear insights on department performance and workforce distribution
• Actionable analytics on salary, gender balance, and employee types
• Interactive filters for deeper, customized analysis
🛠️ Our Core Services
📊 Power BI Dashboards & Business Intelligence
⚙️ Automation (Excel, Python, Google Apps Script)
🧠 Data Analysis & Business Insights
🗄️ SQL Data Management & Transformation
📈 Financial & Operational Reporting
🎯 Impact Delivered
✔ Reduced manual HR reporting time
✔ Improved visibility into workforce trends
✔ Enabled faster, data-driven HR decisions
✔ Identified key areas for retention and optimization
🌟 Why Choose Intersect Analytics?
✔ We focus on data quality first (clean, structured, reliable data)
✔ We deliver end-to-end solutions (from data cleaning to dashboards)
✔ We combine business understanding with technical expertise
✔ We build solutions tailored to your organization—not templates
📩 Let’s transform your HR data into actionable insights
📞 +254 723 632207 (WhatsApp Available)
💡 Intersect Analytics — Turning data into decisions.