
Professional Accountant | Bookkeeping, Financial Reporting

Created a professional investor pitch deck for a customizable bedding business. I combined clean design, structured storytelling, and financial insight to communicate the company’s mission, market opportunity, traction, business model, customer profiles, and financial KPIs.
The deck includes premium slide layouts, branded color themes, clear charts, and subtle animations optimized for live presentations. Perfect for investor meetings, fundraising, and strategic presentations.
Below is the full project link
https://github.com/adetonayusuf/pitch-deck-for-a-start-up/tree/main
#pitchdecks #powerpoint #presentation #anythingappchallenge #rivechallenge #contraeverywhere
1
513

Dynamic Financial Statements with Excel Cube Formulas
I've released an analytics-engineering project demonstrating how to build fully customizable financial reports (I/S, B/S, C/F) using Excel Cube Formulas linked to a Power Pivot data model.
Core Value: Provides finance teams with unrestricted report formatting (solving the Pivot Table layout problem) while ensuring data integrity through a DAX-powered model. The entire report is dynamic, automatically updating for year-to-year comparisons.
Stack: Power Query, Power Pivot, DAX, Excel Cube Formulas.
View the code and detailed explanation: [https://github.com/adetonayusuf/Financial_Statement_with_Cube_Formula]
What's your favorite advanced Excel trick?
1
229

Just completed my end-to-end data engineering project: Customer Weather Demand Analysis
This project demonstrates a full data pipeline, from multi-source data ingestion (customer dumps & real-time weather APIs) to business intelligence. I used Python and Terraform to provision and orchestrate Google Cloud Platform (GCP) resources, transformed the data in Snowflake following a Medallion Architecture, and built a suite of dashboards in Power BI to deliver key insights on how weather impacts customer demand.
Check out the full project code and detailed README on
GitHub: https://github.com/adetonayusuf/maxi_sale_forecast
2
209


Website Designer & Developer | Email Marketer | Branding




Running a business alone can mean switching roles more times than you realise.
In one hour, you might be:
-Conducting a client meeting.
-Responding to a new enquiry.
-Rescheduling an appointment.
-Updating client records.
-Preparing a newsletter.
-Following up on an outstanding payment.
Then the actual work you started the day with gets pushed aside.
For solo business owners and small teams, this constant switching can make the day feel like a never-ending list of responsibilities.
Not every task requires your direct attention.
Routine inbox organisation, appointment coordination, document preparation, CRM updates and newsletter scheduling can often be delegated with clear instructions and appropriate access controls.
The important part is identifying which responsibilities genuinely require your expertise and which simply need to be handled reliably.
You don't have to manage every part of your business yourself to remain in control of how it operates.
Through virtual assistance, website support, CRM management and digital administration, I help business owners take recurring tasks off their hands and keep their operations organised.
If you need an extra pair of capable hands behind the scenes, I'd be happy to support your business.
#VirtualAssistant #AdministrativeSupport #BusinessManagement #CRMManagement #DigitalSupport #SmallBusinessOwner #RemoteSupport #BusinessOperations
0
9

Driving financial efficiency through automation & innovation
Driving financial efficiency through automation & innovation




View more →

Expert Portfolio Management & Investment Analysis
Expert Portfolio Management & Investment Analysis




View more →

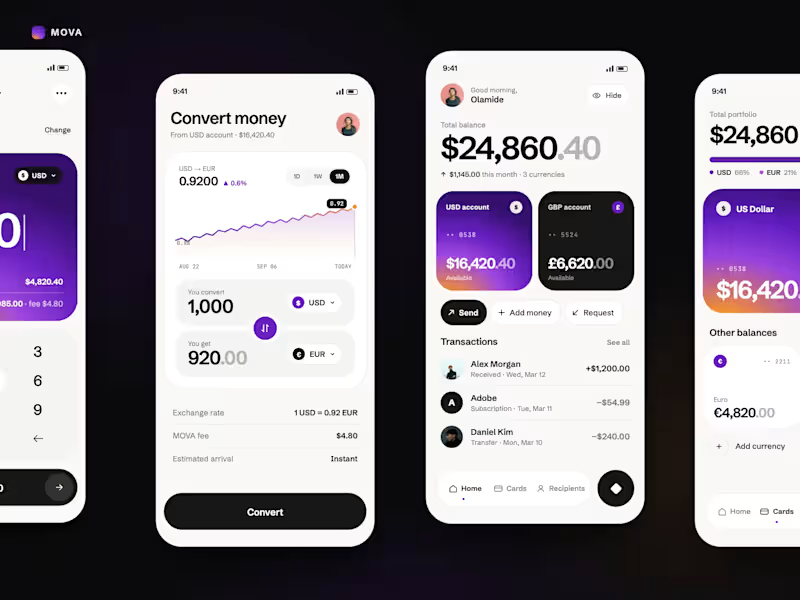
Product designer and No code Developer




AI Automation & CRM Systems | n8n, Chatbots, Workflows
- 5.0
- Rating
- 12
- Followers
AI Automation & CRM Systems | n8n, Chatbots, Workflows



Systematic trading author & Senior Systems Architect & Quant

The Silver Catch-Up: Leveraging Basel III Catalysts and Algorithmic Mean Reversion
Introduction
Market forecasting is the ability to identify the most probable future price movements based on historical patterns and data analysis. To achieve this, traders and analysts must employ robust tools to analyze market data. To get a complete picture of why a market behaves the way it does, both technical factors and seemingly exogenous macroeconomic influences must be studied together.
What You Will Take Away From This Analysis:
Understand the Macro Catalyst: How central bank reserve diversification (the shift from “return on capital” to “return of capital”) and Basel III regulatory frameworks created a structural floor for gold, setting the stage for silver’s mean-reversion catch-up.
Apply a Rule-Based Framework: How to use rolling percentiles (60th/80th) and real-time Pearson correlation to objectively identify market regime changes and avoid “signal fatigue,” replacing subjective guesswork with statistical thresholds.
Download the Free Analytical Toolkit: Access the complete, modular MQL5 toolkit—including the Master Indicator, Correlation Monitor, and Strategy Tester EA—to apply this exact framework to your own charts.
0
74
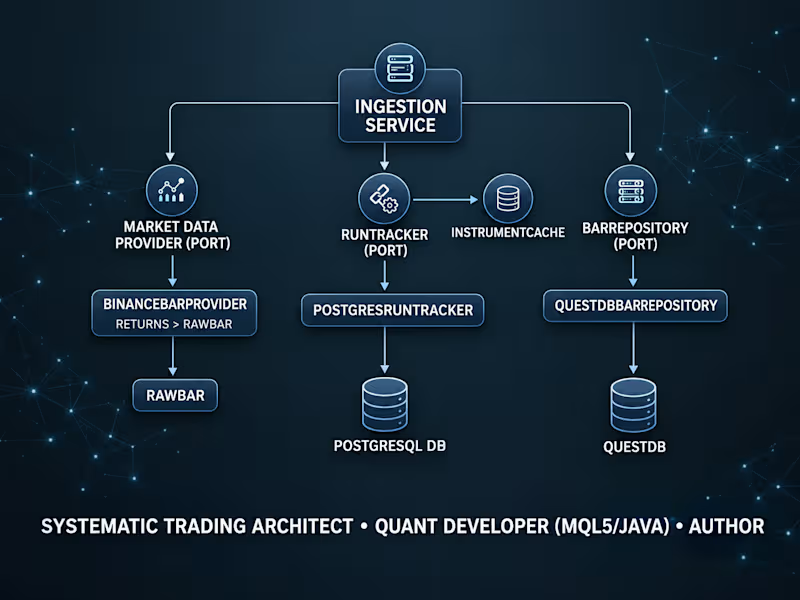
Decoupled Market Data & Analysis Engine (Java / Spring Boot)
Description:
Designed and built a modular algorithmic trading infrastructure demonstrating senior-level backend architecture.
Core Architecture: Utilizes Hexagonal Architecture to completely isolate the core IngestionService and AnalysisService from external dependencies. Implements the Adapter, Repository, Builder, and Dependency Injection patterns.
Data Engineering: Implements a dual-database design. PostgreSQL handles instrument symbology and run-audit logging, while QuestDB manages high-throughput OHLCV time-series data using monthly partitioning and deduplication keys (idempotent upserts).
Pipeline: Autonomously fetches live market data (via REST), parses raw JSON into canonical domain objects, computes statistical indicators (SMA, Z-Score), and stores the analytical results for downstream signal generation.
0
39
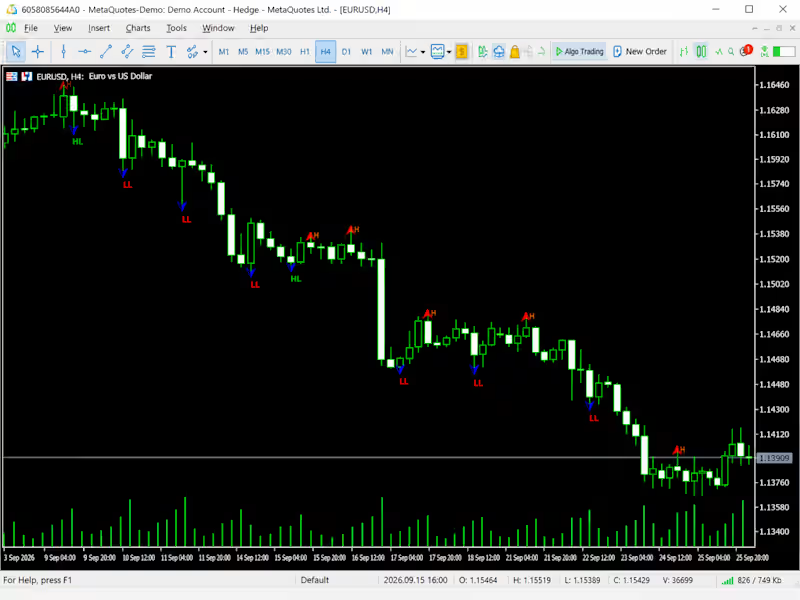
SwingPoints_H4
What it does: Detects swing highs and swing lows on a chart using configurable left/right bar strength, plots them as arrows, and labels each one with its structural classification — HH (higher high), HL (higher low), LH (lower high), or LL (lower low).(This Indicator is designed to be used on the h4 time-frame)
What makes it non-trivial:
Configurable strength. ...
Structural labelling. ...
Object lifecycle management. ...
EA-friendly accessor functions. ...
Buffer-based output. ...
Inputs:
InpLeftBars — ...
InpRightBars — ...
InpMinMovePoints — ...
InpShowLabels — ...
InpMaxBars — ...
Dependencies: None. Standalone indicator.
0
57
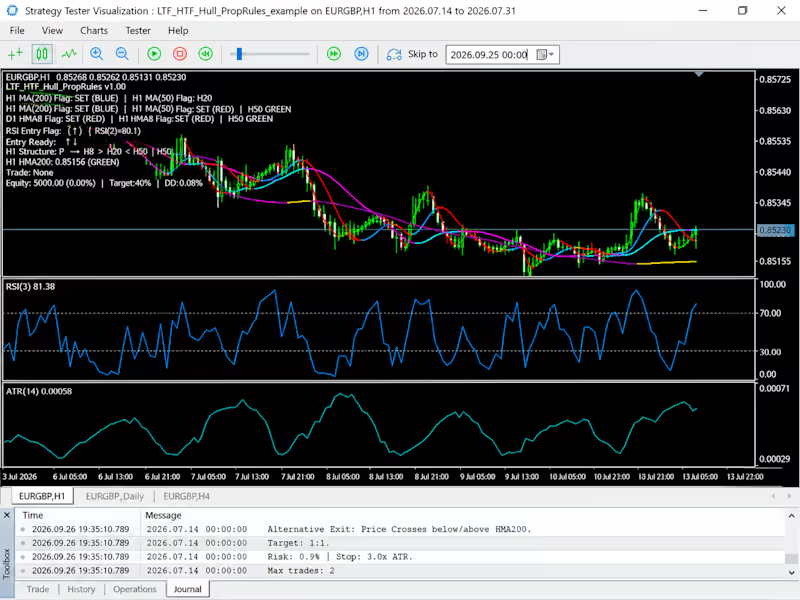
LTF_HTF_Hull_PropRules (the Prop Trader EA)
Multi-timeframe mean-reversion EA using an LTF → HTF approach. H1 HMA200 sets the directional anchor, H4 HMA20/HMA50 confirms structure, D1 HMA8 sets the higher-timeframe colour filter, and H1 RSI(3) times the entry. Each timeframe sets a persistent flag that remains valid until its own condition breaks; the EA only trades when all four flags agree on direction. Stop = 3× H1 ATR, target = 1:1. Includes a full prop-firm risk layer: profit-target kill switch, maximum total drawdown limit, optional daily drawdown limit, minimum valid trading days counter, and per-day CSV logging of every event. Requires the UnifiedHullMA indicator.(Note: This is for educational purposes only, it is not intended as a deployable strategy for the live market)
0
68

Data Analyst | Leveraging Data to uncover Insights.
Data Analyst | Leveraging Data to uncover Insights.


View more →