Product & UI/UX Developer | Figma | Framer | Brand Designer

Gym & Fitness landing Page
This concept reimagines the gym experience in the digital era a platform where motivation meets design, and every workout feels empowering.
I designed a modern, high-energy landing page Ul that combines bold typography, powerful imagery, and a dynamic layout to reflect movement, strength, and determination. The interface emphasizes clarity and motivation, helping users explore classes, track progress, and stay inspired on their fitness journey.
To bring the experience to life, I integrated subtle motion effects and interactive elements that mirror the rhythm and intensity of a real workout.
The goal was to fuse fitness UI, modern aesthetics, and interactive design to create an immersive online gym experience that motivates users to push their limits anytime, anywhere.
Would love your feedback! Get reply within 10 Minutes!
Looking to build some great together??
GET IN TOUCH.....
1
4
246


UI/UX Designer designing websites and apps that converts
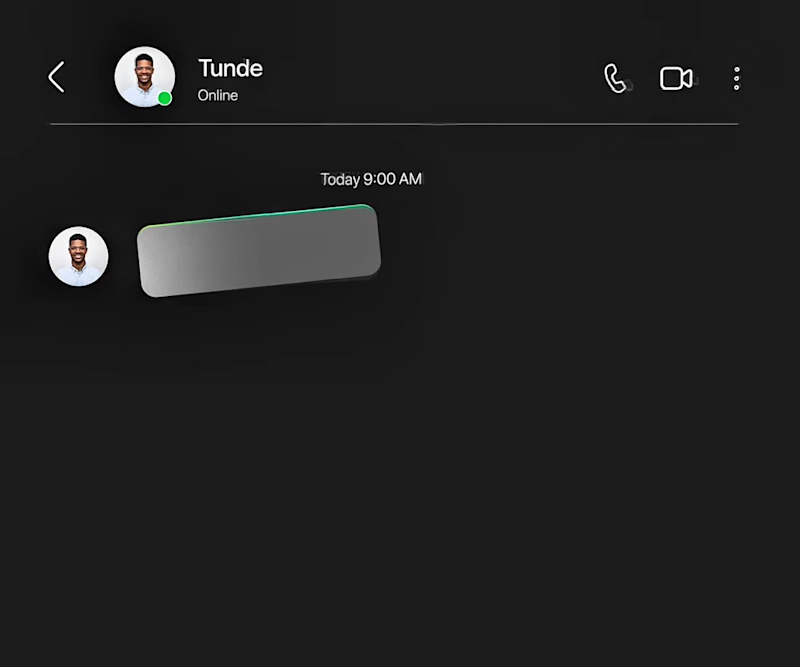
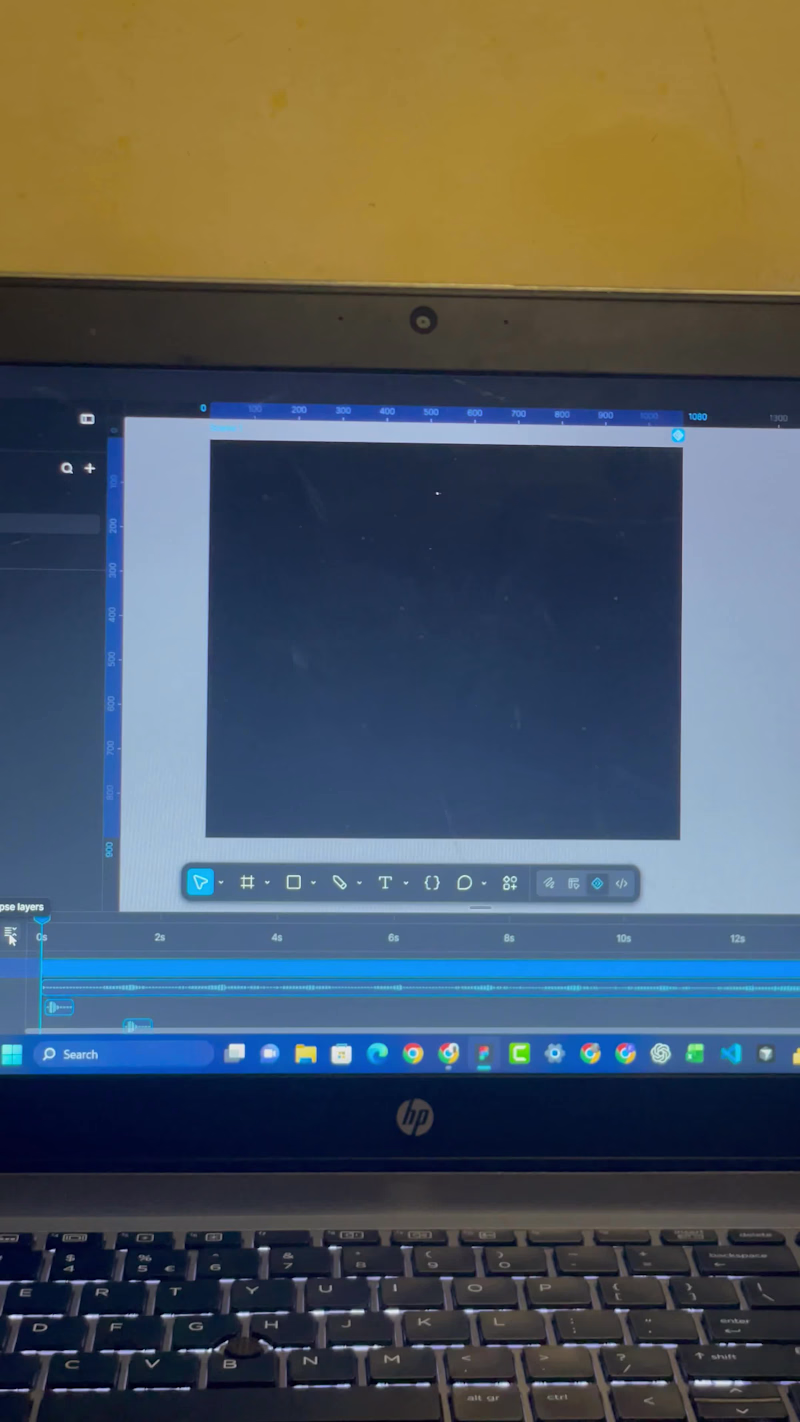
Created this indrive Ads using Figma motion.
Here’s the storyline: most people complain of high prices of ride, so I offered indrive as the solution.
with indrive, book your ride and agree on a comfortable price with your driver.
So basically, the problem is high ride prices and the solution is Indrive.
Good motion design is meant to identify the problem and offer a solution.
Started the design with the storyboard made up of up to 7 scenes and animated it.
What is good motion design to you?
2
3
101
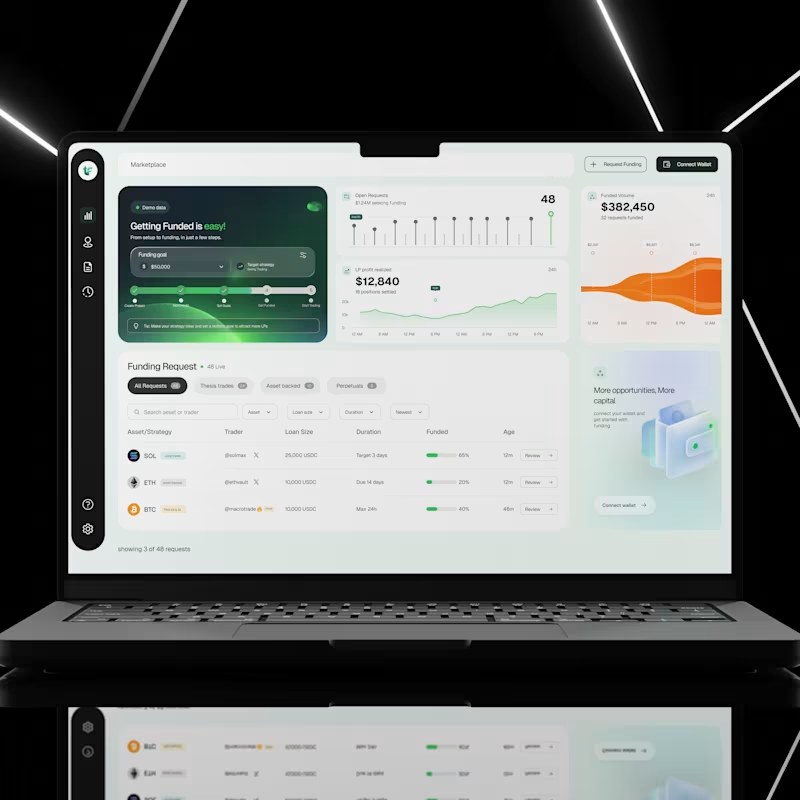
I designed a crypto funding dashboard that helps users explore funding requests, track market activity, and understand important financial information from one place.
Crypto platforms can be difficult to use, especially when users have to deal with numbers, charts, different assets, and funding options all at once.
My goal was to create an interface that makes these activities easier to understand, keeps important information within reach, and helps users find what they need without feeling overwhelmed.
The Challenge
Financial dashboards often contain too much information on one screen. When charts, numbers, filters, and tables are not properly organised, users can struggle to find important details or understand what is happening.
I wanted to solve this by creating a dashboard that feels clean, organised, and easy to navigate, even when displaying a lot of information.
My Design Approach
1. A clear overview of important information
I designed dashboard cards to show key figures, including open funding requests, funded volume, and realised liquidity provider (LP) profit.
This allows users to quickly understand what is happening without having to search through multiple pages.
2. A visual way to understand data
Instead of presenting financial information as numbers alone, I used charts and graphs to help users see changes and patterns over time.
The goal was to make complex information easier to understand at a glance.
3. An organised funding request section
I created a dedicated section where users can explore different funding requests.
Requests are grouped into categories, with search, filters, and sorting options to help users narrow down the information they need.
The table also displays important details such as the asset, trader, loan size, duration, funding progress, and request age.
This makes it easier to compare opportunities without opening every request individually.
4. A simple navigation system
I used a sidebar to keep the main navigation accessible and organised.
This helps users move between different sections of the platform without cluttering the main workspace.
5. Clear calls to action
Actions such as Request Funding, Connect Wallet, and Review are easy to find.
I wanted users to understand what they could do next without having to guess where to click.
6. A consistent visual design
I combined a clean layout, generous spacing, rounded cards, and a restrained colour palette to create a modern interface.
Green highlights important financial indicators and progress, while the darker sidebar creates a clear visual separation between navigation and the main dashboard.
The UX Thinking Behind the Design
For me, good dashboard design is not just about making numbers look attractive.
It is about helping people understand information, find what they need, and take action with less effort.
Every section of this interface has a purpose. The overview provides a quick summary, the charts help users understand activity, and the funding table makes it easier to explore individual requests.
The goal was simple: turn a screen full of financial information into an experience that feels clear, organised, and easy to use.
Key UX Principles Applied
Visual hierarchy: Important information stands out first.
Information architecture: Related information is grouped together logically.
Data visualisation: Charts make financial activity easier to understand.
Efficient navigation: Users can access key sections quickly.
Consistency: Reusable components create a predictable experience.
Usability: Search, filters, and clear actions help users complete tasks more easily.
This project is a reminder that a good user interface does more than look good. It helps people understand what they are seeing and what they can do with that information.
As a UI/UX designer, I focus on finding the balance between visual appeal, useful functionality, and a smooth user experience.
Have a dashboard or financial product that needs a better user experience? Let's work together.
1
2
90

Visual & Brand Identity Design | Social Media Designs




Website Designer & Developer | Email Marketer | Branding

Running a business alone can mean switching roles more times than you realise.
In one hour, you might be:
-Conducting a client meeting.
-Responding to a new enquiry.
-Rescheduling an appointment.
-Updating client records.
-Preparing a newsletter.
-Following up on an outstanding payment.
Then the actual work you started the day with gets pushed aside.
For solo business owners and small teams, this constant switching can make the day feel like a never-ending list of responsibilities.
Not every task requires your direct attention.
Routine inbox organisation, appointment coordination, document preparation, CRM updates and newsletter scheduling can often be delegated with clear instructions and appropriate access controls.
The important part is identifying which responsibilities genuinely require your expertise and which simply need to be handled reliably.
You don't have to manage every part of your business yourself to remain in control of how it operates.
Through virtual assistance, website support, CRM management and digital administration, I help business owners take recurring tasks off their hands and keep their operations organised.
If you need an extra pair of capable hands behind the scenes, I'd be happy to support your business.
#VirtualAssistant #AdministrativeSupport #BusinessManagement #CRMManagement #DigitalSupport #SmallBusinessOwner #RemoteSupport #BusinessOperations
0
9

Someone who downloaded your free business guide isn't necessarily ready to buy your programme.
And someone who has already completed your programme probably doesn't need the same introductory email as a new subscriber.
Yet many businesses communicate with their entire email list as though everyone has the same needs.
This can make email marketing feel repetitive and less relevant.
A better approach is to organise subscribers based on their interests and relationship with the business.
For example, a business coach could distinguish between:
-People who downloaded a free resource.
-Subscribers interested in a particular coaching programme.
-Existing or previous clients.
-People who regularly engage with newsletters.
With thoughtful email segmentation and targeted email automation, each group can receive communication that makes sense for where they are.
This isn't about sending more emails. It's about making the emails you already send more meaningful.
I help businesses organise their email marketing, segment subscriber lists and build email campaigns and automations using platforms such as Mailchimp and Klaviyo.
If your email list needs better organisation or your campaigns aren't reaching the right audience, I can help you improve your email marketing.
1
2
139