Freelancers using Apps Script in Kefar Sava
Freelancers using Apps Script in Kefar Sava
Sign Up
Post a job
Sign Up
Log In
Filters
2
Projects
People
Shay Hail
Ramat Gan, Israel
Zendesk & BI specialist in decision-grade reporting
New to Contra
Follow
Message
Zendesk & BI specialist in decision-grade reporting
0
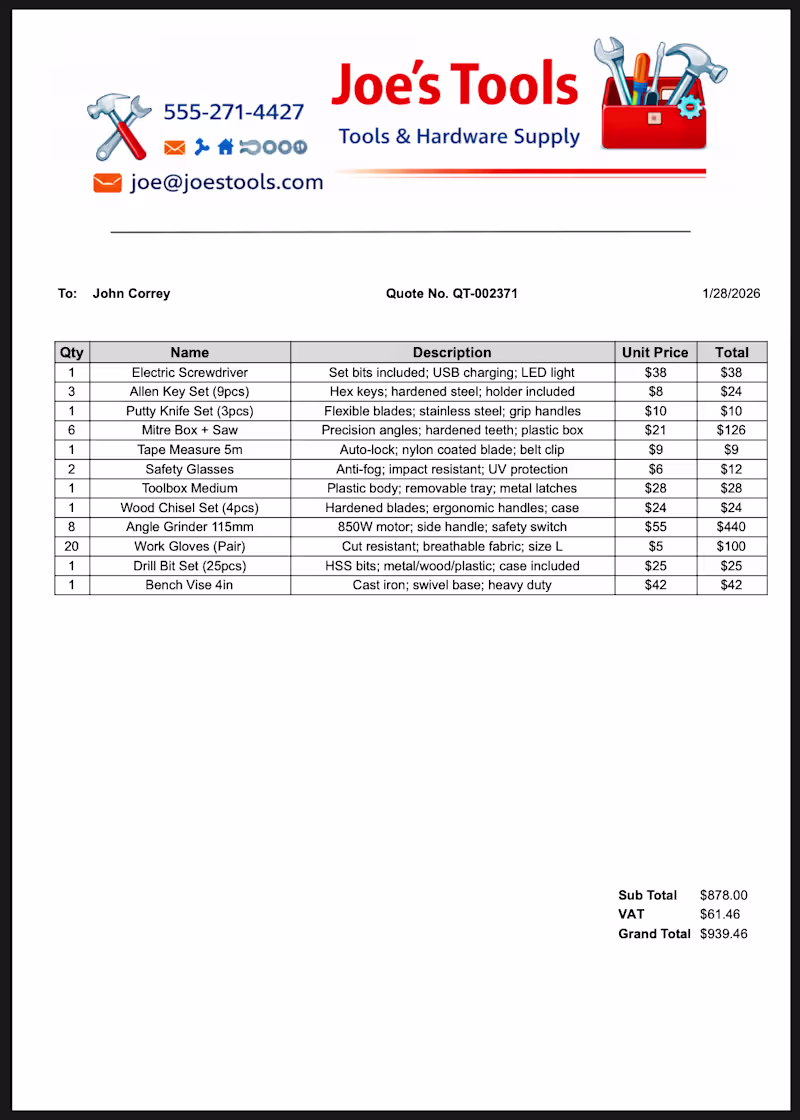
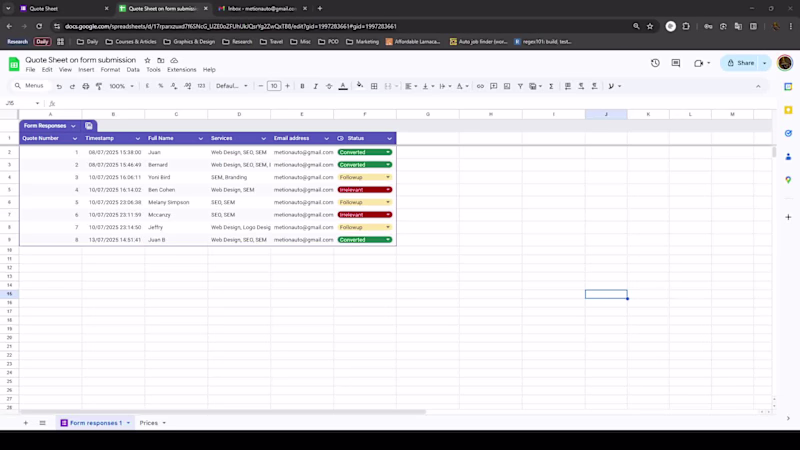
Designed and built an automated Google Sheets quote system with a dynamic product catalog, line-item calculations, and PDF export. Features include drop-down based item selection, automatic pricing and totals, protected summary sections, and one-click PDF generation for client-ready quotes. Built to scale for dozens of items while maintaining a clean printable layout.
0
29
2
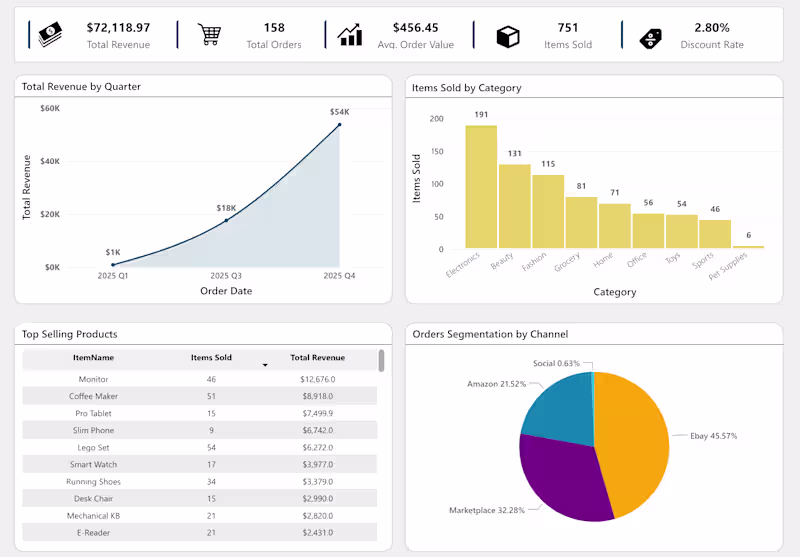
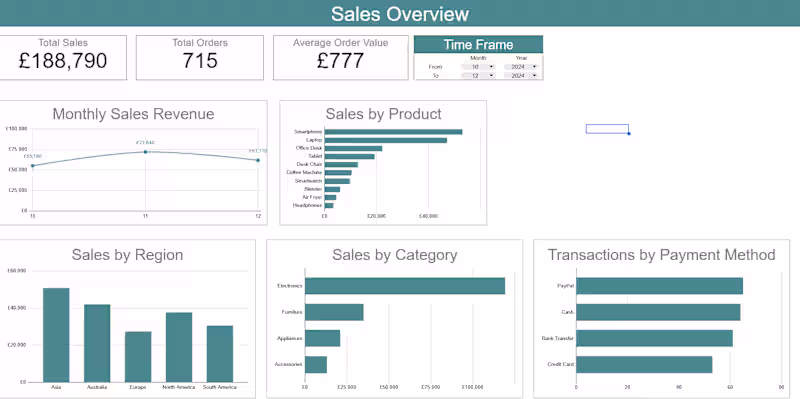
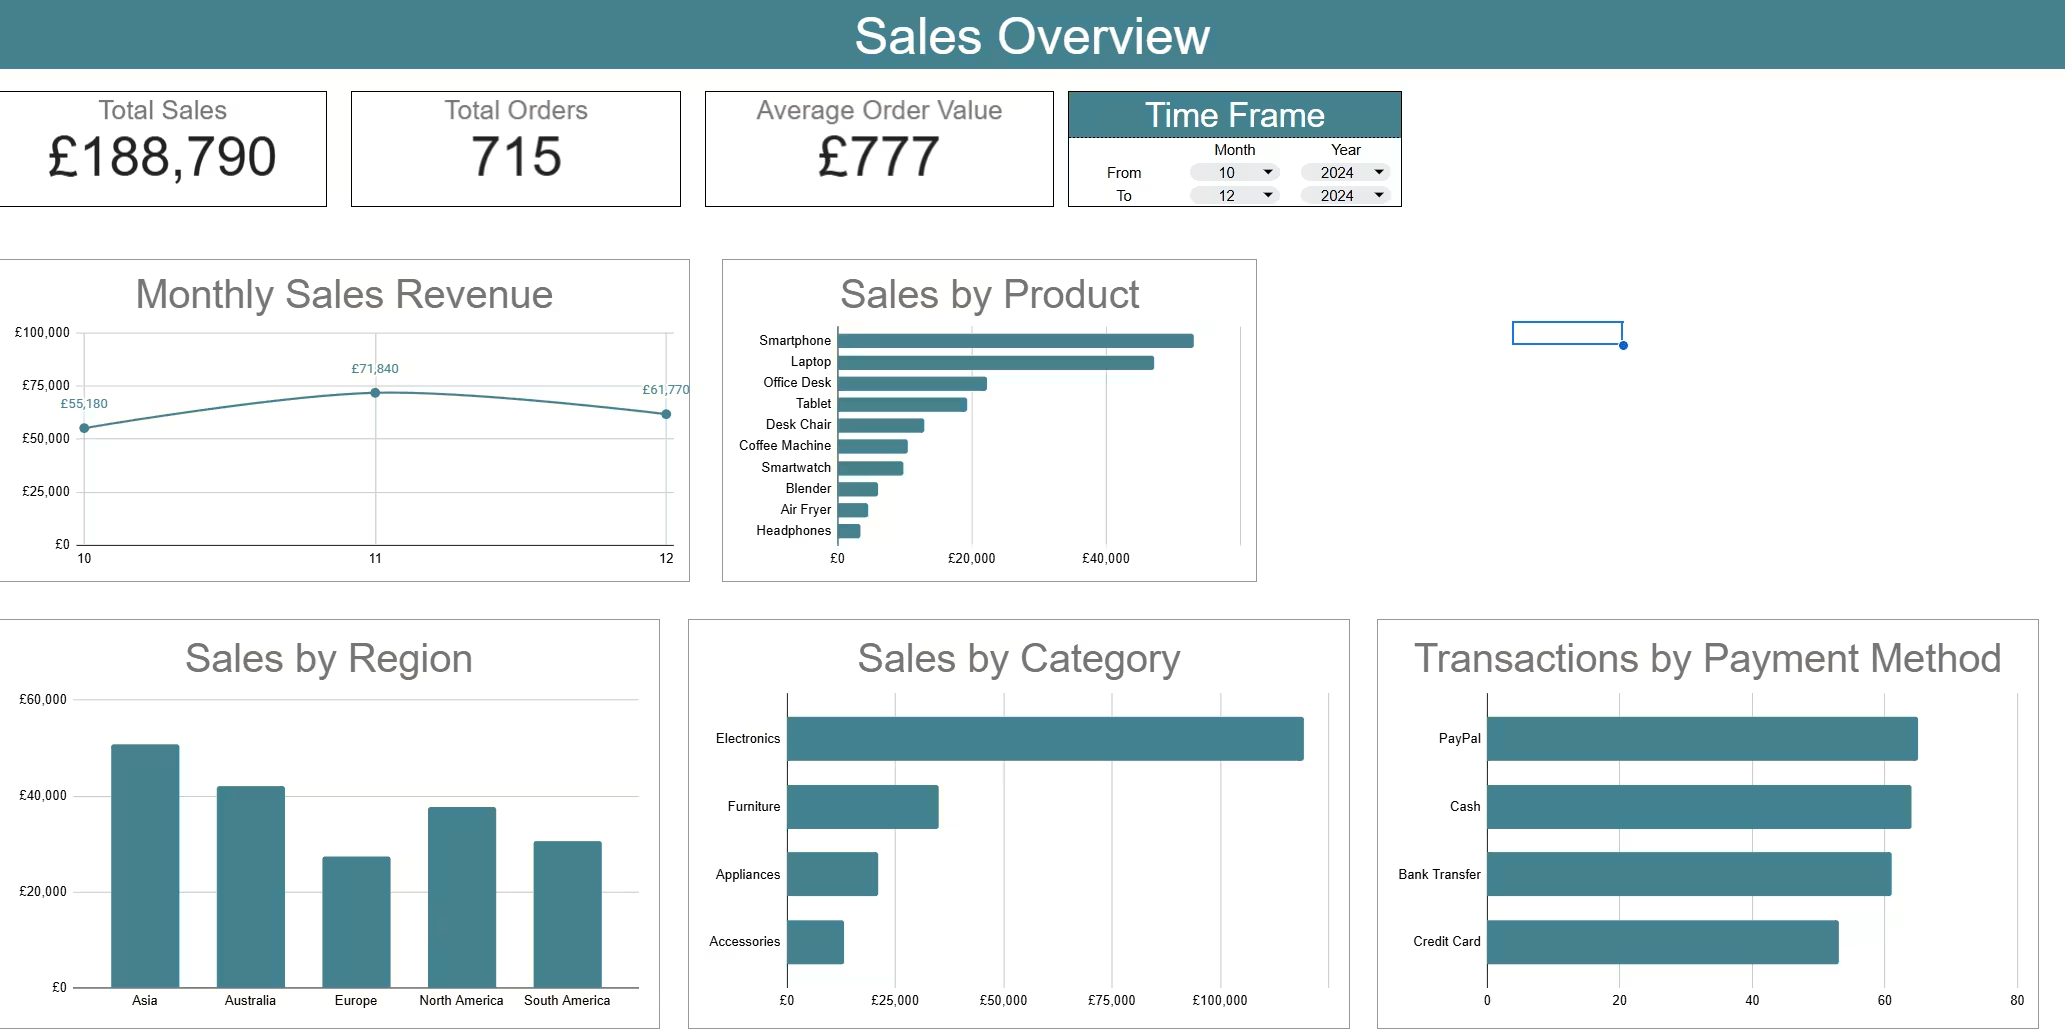
A practical Google Sheets project of a lightweight operational dashboard, designed for clarity, speed, and day-to-day usability. The dashboard surfaces core metrics and summaries using native formulas, filters, and conditional logic, enabling quick inspection without external BI tools. The setup emphasizes simplicity and reliability: minimal dependencies, transparent calculations, and layouts optimized for both on-screen use and client-facing documents, allowing teams to work directly in Sheets without friction.
1
2
53
0
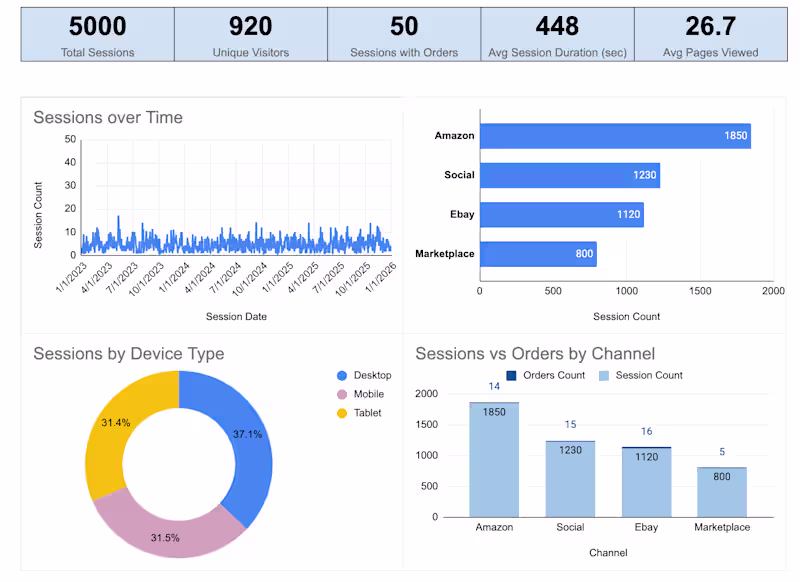
A structured analytical view built to expose how demand, behavior, and outcomes move through the system with zero ambiguity. It focuses on core business mechanics-traffic, conversion, efficiency, and value generation-while enforcing stable metric logic and a coherent data model so trends, inflection points, and performance gaps surface immediately. The design minimizes analytical friction through disciplined segmentation, consistent time logic, and layouts that reveal performance dynamics without manual cross-filtering or interpretive guesswork.
0
37
2
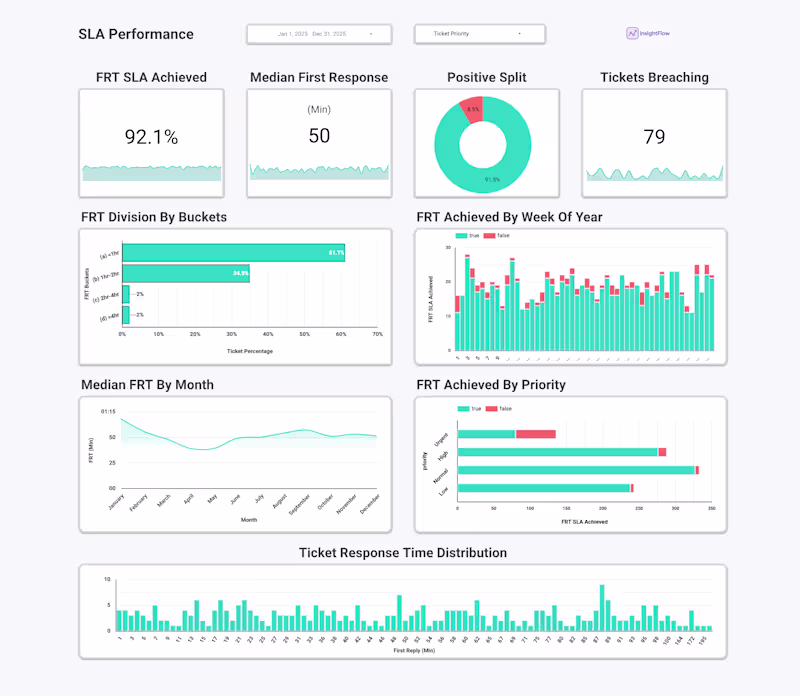
A consolidated operational dashboard built in Looker Studio, designed for fast diagnostics and workflow clarity across support operations. It surfaces core KPIs including SLA attainment, ticket volume, first-response performance, and priority distribution, paired with temporal breakdowns by month, hour, and category. The layout emphasizes immediate visibility into service health, workload patterns, and trend deviations, enabling teams to act on data rather than hunt for it.
1
2
48
Apps Script
(2)
Follow
Message
juan burstein
Kefar Sava, Israel
Data Processing & Automation Specialist
Follow
Message
Data Processing & Automation Specialist
0
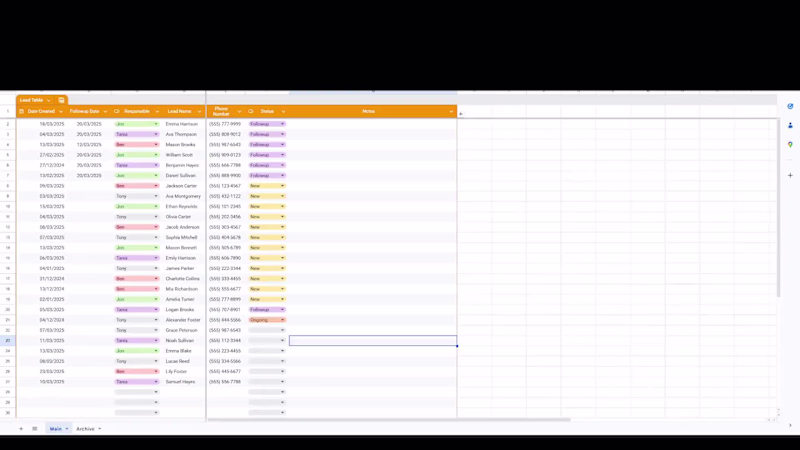
Lead Management Automation
0
2
0
Ecommerce Dashboard
0
1
0
Automated Offers
0
0
View more →
Apps Script
(2)
Follow
Message
Explore people