Data Visualization Projects in KagalData Visualization Projects in Kagal🚀 SQL & Tableau Project | Sales Analytics Dashboard
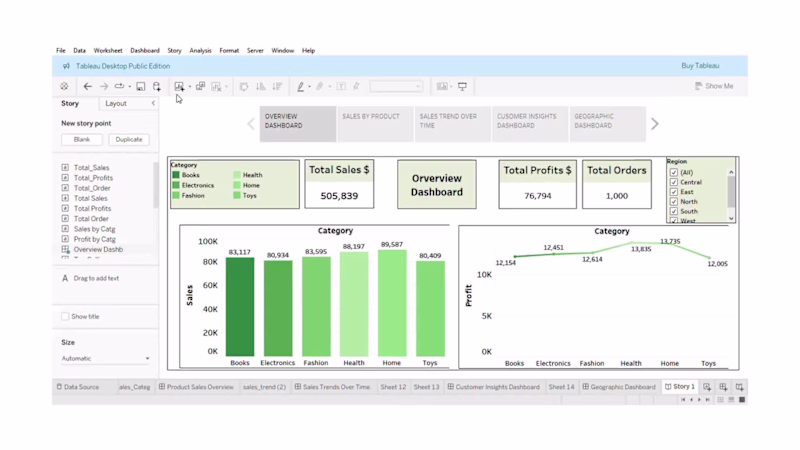
To practice real-world analytics, I built an interactive Sales Analytics Dashboard using SQL & Tableau to analyze sales performance and customer behavior.
🔹 Dataset Highlights
OrderID, CustomerID, Product, Category, Sales, Quantity, Discount, Profit, Region, OrderDate
🔹 Dashboard Coverage
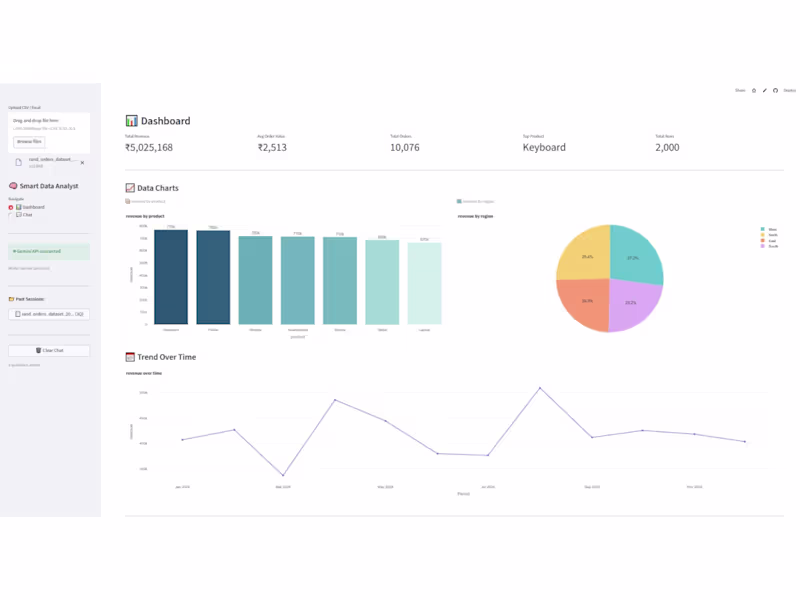
• Sales overview: Total Sales, Profit & Orders
• Product performance: Top-selling products & category insights
• Monthly sales trends
🔹 Tools Used
• SQL
• Tableau
🔹 Key Insights
• A small customer segment drives most revenue
• Certain product categories consistently outperform others
• Clear seasonal sales patterns
🔹 What I Learned
• Writing efficient SQL queries for analysis
• Translating numbers into business-friendly visuals
• Designing dashboards that support data-driven decisions