Data Analysis Projects in Islamabad Capital TerritoryData Analysis Projects in Islamabad Capital TerritoryOGDCL Medical Analytics Dashboard
Designed and developed an interactive medical analytics dashboard during my AI-focused internship at Oil & Gas Development Company Limited (OGDCL), transforming a large healthcare dataset into clear, actionable visual insights.
The project focused on making complex medical and employee-visit data easier to analyze through structured KPIs, interactive visualizations, and an intuitive dashboard interface.
Key Features
Interactive medical data analytics dashboard
KPI cards for monitoring key healthcare metrics
Analysis of total visits and unique employee visits
Identification and visualization of top diseases and diagnoses
Demographic analysis including age and gender distributions
Analysis of medical visits across different locations and specialties
Interactive filters for exploring specific segments of the dataset
Clean visual hierarchy designed for quick decision-making
Data preparation and transformation before visualization
Dashboard structure designed to make large-scale healthcare data easier to understand
Data & Analytics
Worked with approximately 350,000 medical visit records containing fields related to patient visits, diagnoses, demographics, doctors, specialties, referrals, laboratory tests, and healthcare providers.
Because the underlying dataset contained sensitive medical information, the project focused on analytics and visualization rather than exposing identifiable patient information.
Tools
Power BI · Microsoft Excel · Data Analysis · Data Visualization · Data Cleaning · Healthcare Analytics
My Role
AI Intern — Data Analytics & Dashboard Development
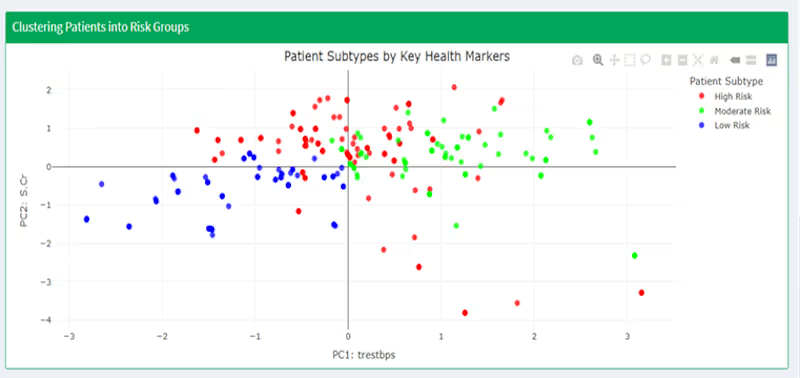
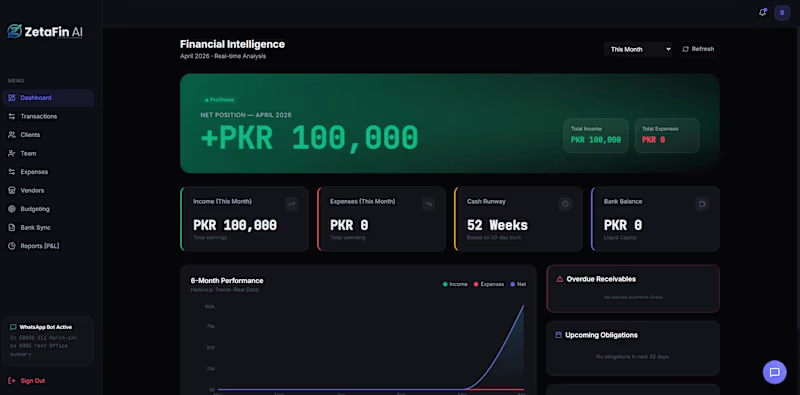
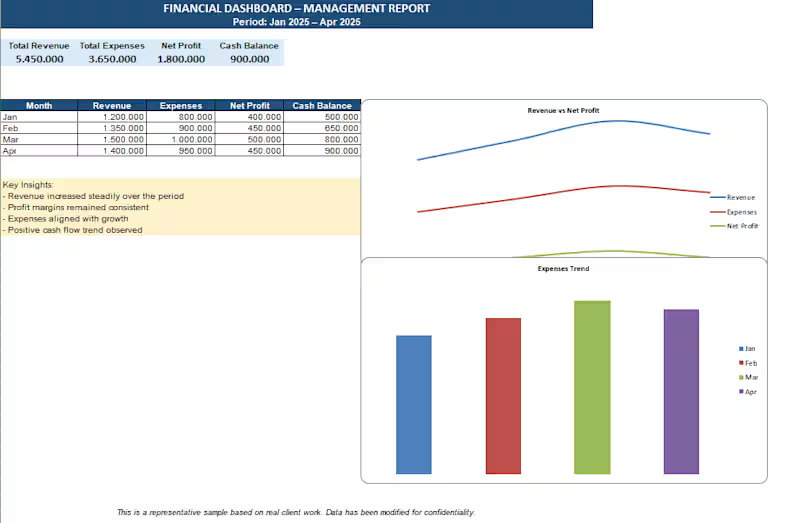
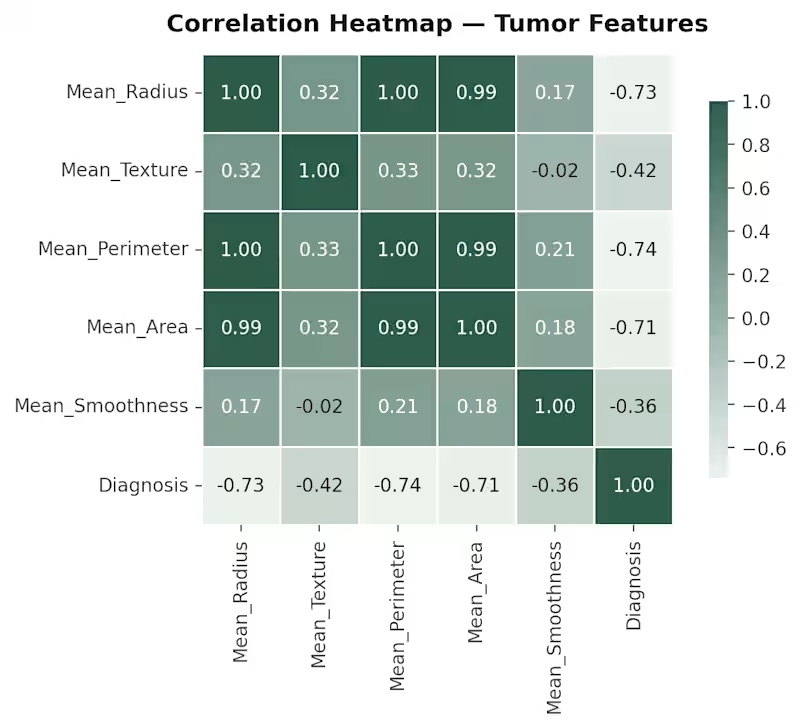
Handled the data preparation, analysis, visualization strategy, KPI design, and dashboard development, translating a large and complex healthcare dataset into an interactive analytics experience suitable for organizational decision-making. Built ZetaFin — an intelligent financial tracking and reporting system that gives business owners a real-time view of their Profit & Loss without touching a spreadsheet. The system connects to the client's revenue sources (Stripe, PayPal, bank feeds), expense trackers, and invoicing tools, then automatically categorizes every transaction using AI, calculates live margins, flags anomalies, and generates a clean P&L report delivered to the client's inbox every Monday morning. An AI analysis layer adds context to every report — explaining why revenue increased or dropped, which expense categories are trending up, and what actions the owner should consider. Built entirely on n8n with OpenAI for financial analysis and Google Sheets as the live dashboard. The client — an e-commerce founder — went from spending 3 hours every week manually reconciling finances to receiving a fully analyzed, actionable report automatically. For a Predictive Analytics test model, I built two predictive models for clinical outcomes: a logistic regression classifier diagnosing tumours as malignant/benign (89.5% accuracy, 0.97 AUC) on the Breast Cancer Wisconsin dataset, and a multiple linear regression model predicting diabetes disease progression (R² = 0.49) from BMI, blood pressure, and cholesterol markers. Covered the full pipeline: EDA, multicollinearity diagnostics, train/test splitting, feature scaling, model evaluation, and individual patient-level predictions with clinical interpretation