Projects using Matplotlib in IslamabadProjects using Matplotlib in IslamabadOGDCL Medical Analytics Dashboard
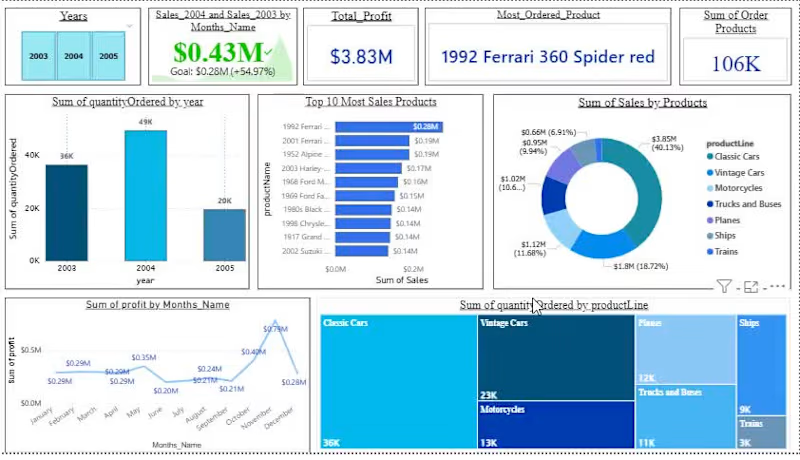
Designed and developed an interactive medical analytics dashboard during my AI-focused internship at Oil & Gas Development Company Limited (OGDCL), transforming a large healthcare dataset into clear, actionable visual insights.
The project focused on making complex medical and employee-visit data easier to analyze through structured KPIs, interactive visualizations, and an intuitive dashboard interface.
Key Features
Interactive medical data analytics dashboard
KPI cards for monitoring key healthcare metrics
Analysis of total visits and unique employee visits
Identification and visualization of top diseases and diagnoses
Demographic analysis including age and gender distributions
Analysis of medical visits across different locations and specialties
Interactive filters for exploring specific segments of the dataset
Clean visual hierarchy designed for quick decision-making
Data preparation and transformation before visualization
Dashboard structure designed to make large-scale healthcare data easier to understand
Data & Analytics
Worked with approximately 350,000 medical visit records containing fields related to patient visits, diagnoses, demographics, doctors, specialties, referrals, laboratory tests, and healthcare providers.
Because the underlying dataset contained sensitive medical information, the project focused on analytics and visualization rather than exposing identifiable patient information.
Tools
Power BI · Microsoft Excel · Data Analysis · Data Visualization · Data Cleaning · Healthcare Analytics
My Role
AI Intern — Data Analytics & Dashboard Development
Handled the data preparation, analysis, visualization strategy, KPI design, and dashboard development, translating a large and complex healthcare dataset into an interactive analytics experience suitable for organizational decision-making.