


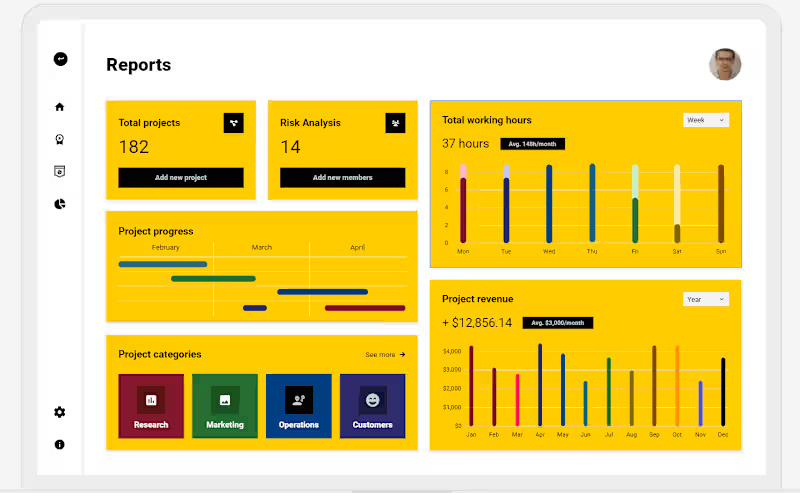


This dashboard is based on data from a WhatsApp group of a community. It is a housing complex divided into lanes. Each lane has a separate WhatsApp group, and NLP was performed on discussions. Issues related to 3 utilities were considered in reports, i.e., water, electricity, and gas. The community wanted to see the frequency of issues and who is more active to highlight the issues.
0
38

🧠 Introducing NLP-Assistant!
> Smart Workflow Detection: AI suggests the optimal analysis path for maximum insight.
> Specialized Workflows: Dedicated analysis for diverse content, including PII detection, hashtag extraction, and citation analysis.
> Comprehensive Analytics: Get detailed text stats, VADER sentiment scoring, and interactive Plotly visualizations.
>> Check out the repo, give it a star, and try transforming your text data into actionable insights! 👇
github.com/WaqasAhmed27/NLP-Assistant (https://github.com/WaqasAhmed27/NLP-Assistant)
0
79
