Projects using Chart.js in Indore
Projects using Chart.js in Indore
Sign Up
Post a job
Sign Up
Log In
Filters
2
Projects
People
3
Bulbul Gupta
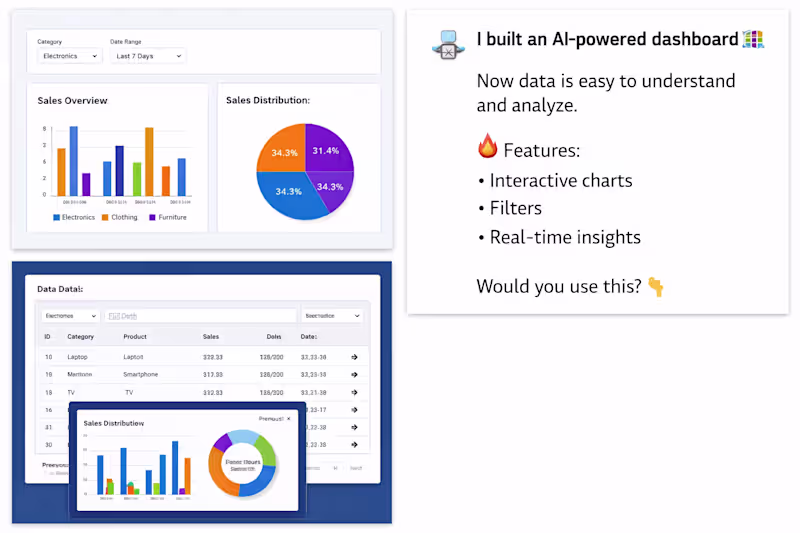
📊 I built an AI-powered data dashboard Now data is easy to understand and analyze. No more manual work ❌ Just filter → Get insights instantly ⚡ 🔥 Features: • Interactive charts • Smart filters • Real-time insights ⚙️ Tech: Python, Flask, PostgreSQL, Chart.js 💡 Perfect for: Businesses, analysts, startups 💬 Want a dashboard like this? DM me 🚀
3
171
2
Bulbul Gupta
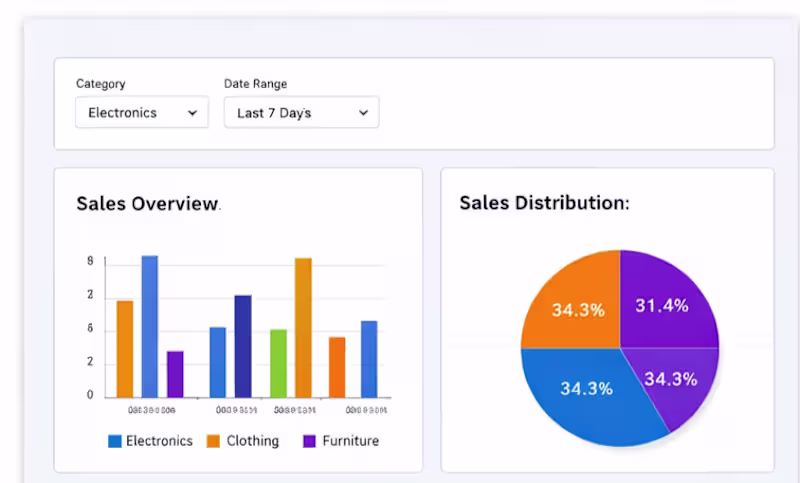
Built an AI-powered data visualization dashboard that helps users analyze and understand data easily through interactive charts and filters. The system fetches data from a database and displays it in real-time using dynamic charts and tables. Users can apply filters to explore specific insights and make better decisions. 💡 This solution is useful for businesses, analysts, and teams to track performance, monitor trends, and simplify complex data. 🔥 Key Highlights: • Interactive charts (bar, pie) • Dynamic data filtering • Real-time data updates ⚙️ Built using Python, Flask, PostgreSQL, and Chart.js. DM me
1
2
152
Explore projects