The network for creativity
Join 1.25M professional creatives like you
Connect with clients, get discovered, and run your business 100% commission-free
Creatives on Contra have earned over $150M and we are just getting started
Back to feedPost
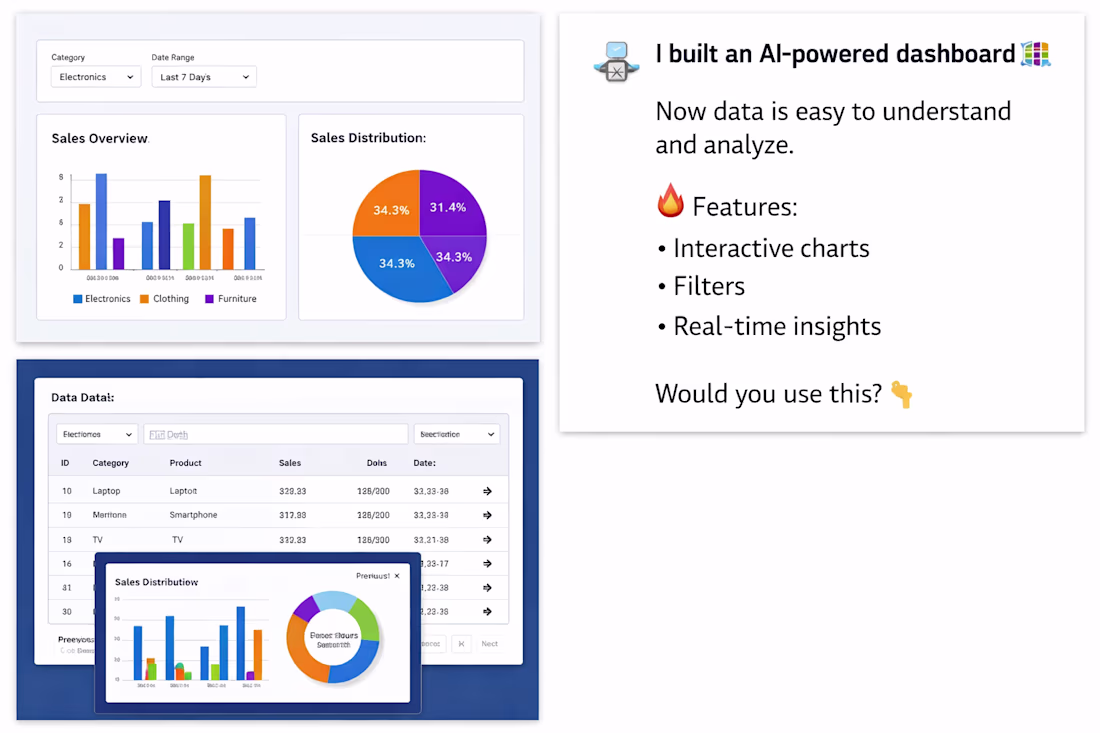
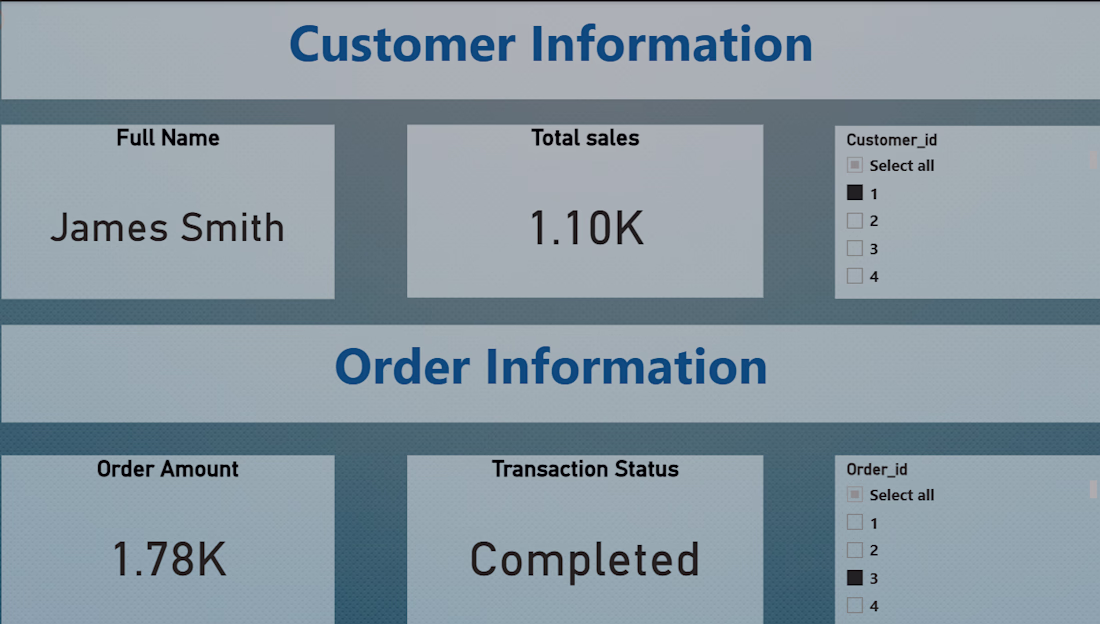
Built an AI-powered data visualization dashboard that helps users analyze and understand data easily through interactive charts and filters.
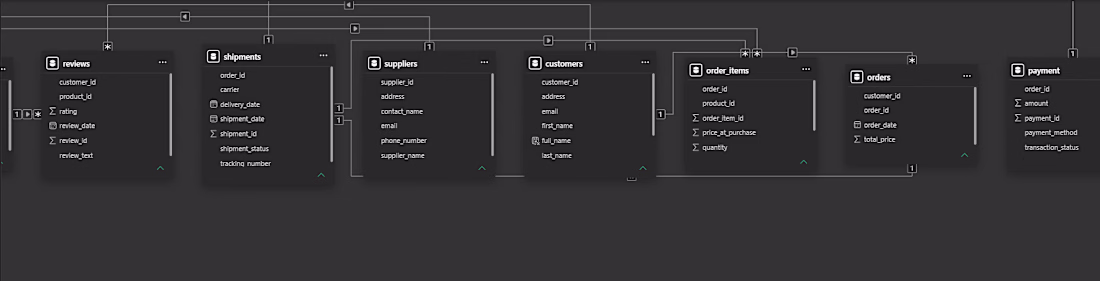
The system fetches data from a database and displays it in real-time using dynamic charts and tables. Users can apply filters to explore specific insights and make better decisions.
💡 This solution is useful for businesses, analysts, and teams to track performance, monitor trends, and simplify complex data.
🔥 Key Highlights:
• Interactive charts (bar, pie)
• Dynamic data filtering
• Real-time data updates
⚙️ Built using Python, Flask, PostgreSQL, and Chart.js.
DM me
If anyone is looking to build AI tools like this, feel free to reach out. Happy to help 🚀
The network for creativity
Join 1.25M professional creatives like you
Connect with clients, get discovered, and run your business 100% commission-free
Creatives on Contra have earned over $150M and we are just getting started
Trending
Claude
Claude has entered the design space. How are you using it?
Contra University
Learn from expert creatives how to earn more using next-gen AI tools.
Brand Design
The best brand designers are on Contra. Scroll to see what's trending in brand design. What are you building?
creativeaiflow
Creative AI workflows are evolving. What tools do you use, and what are their strengths and weaknesses?
freelancerlife
Freelancer life is wins, pivots, and everything in between. What’s yours right now?
Related posts
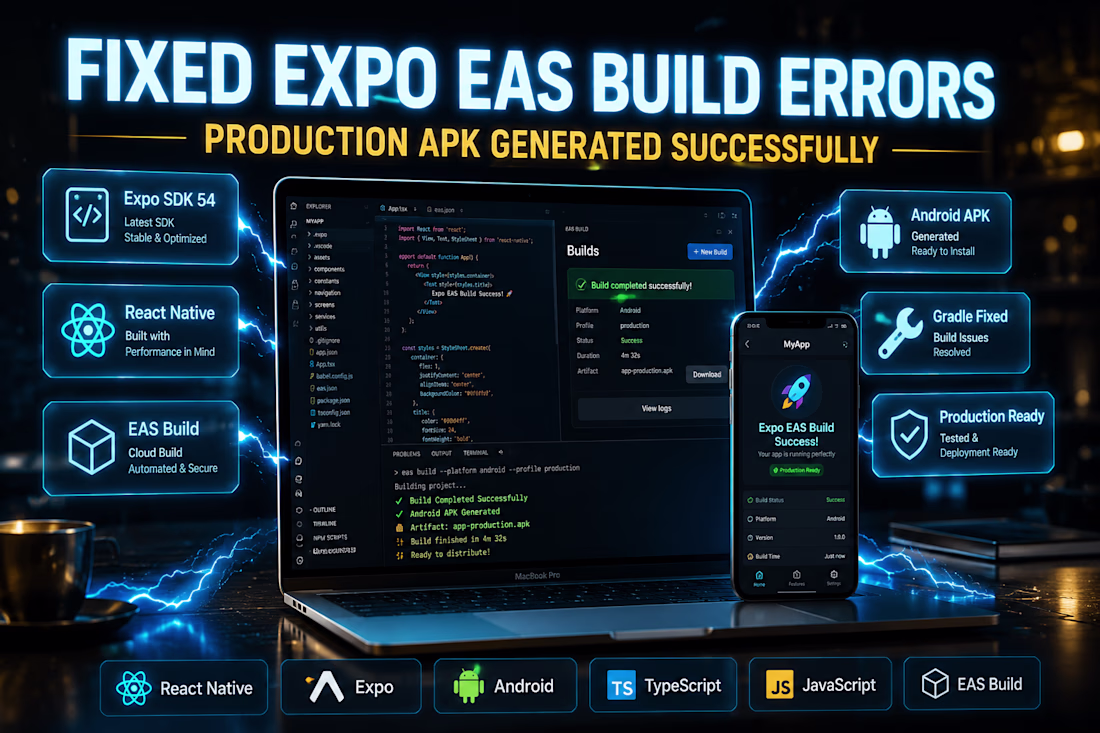
Spent today fixing multiple Expo EAS Build issues that prevented an Android APK from being generated. Resolved dependency conflicts, SDK version mismatches, Gradle configuration, and native build errors to deliver a successful production-ready build.
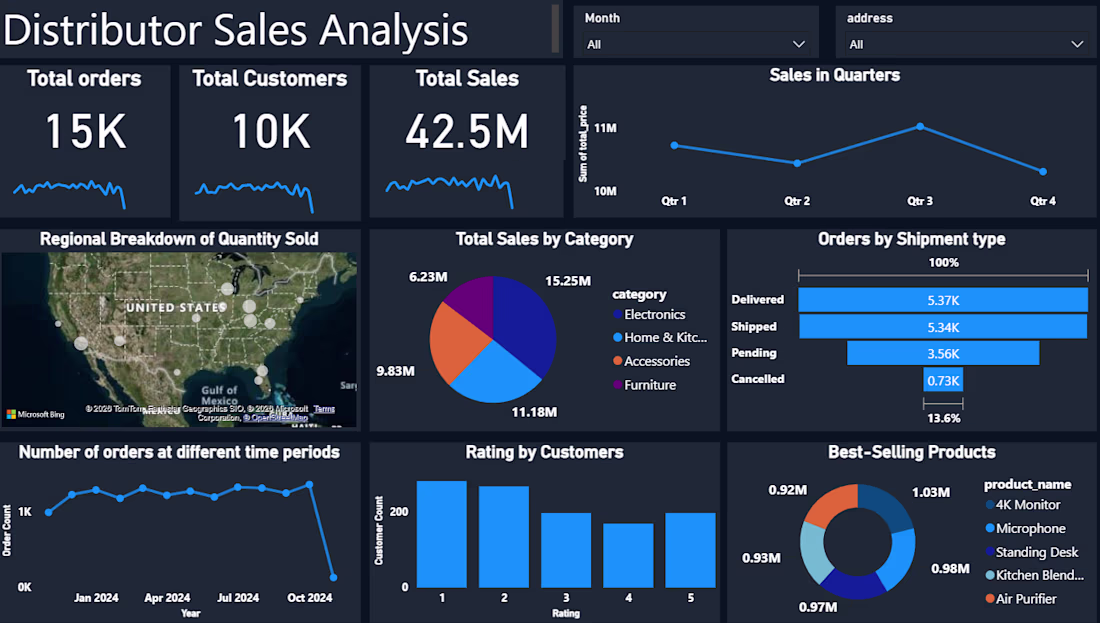
Sales Analytics Dashboard
Designed an interactive Power bi Dashboard to help track sales performance, revenue, profit, and business trends in a simple and visually clear way. The dashboard includes KPI cards, regional and category-wise analysis, trend tracking, and dynamic filters for better insights and decision-making. Built using Power BI, DAX, Power Query, and data visualization techniques with a clean and user-friendly layout.
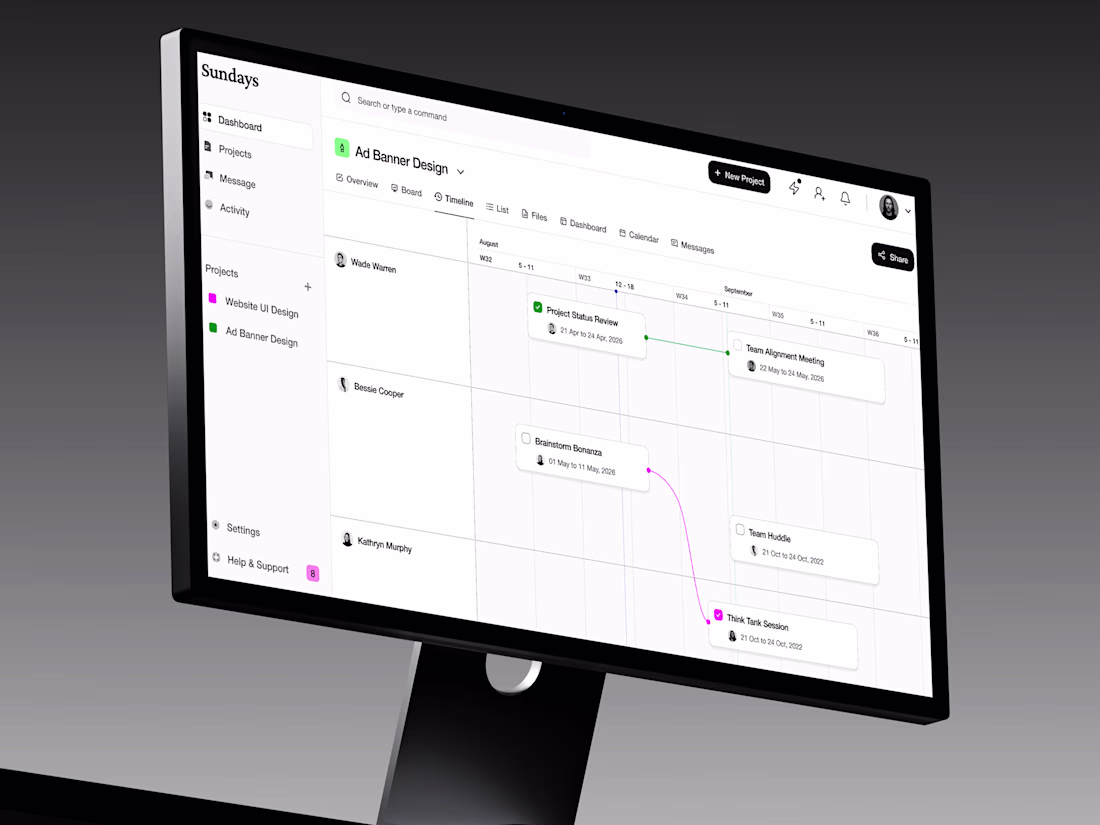
Boost team productivity with a modern AI Agent Project Management Dashboard designed to automate workflows, track tasks, manage projects, and provide real-time insights. The dashboard combines AI-powered assistance with intuitive project management, helping teams prioritise work, monitor progress, reduce manual effort, and make faster decisions through smart analytics and automation.