Data Analysis Projects in Indore
Data Analysis Projects in Indore
Sign Up
Post a job
Sign Up
Log In
Filters
2
Projects
People
Message
3
Bulbul Gupta
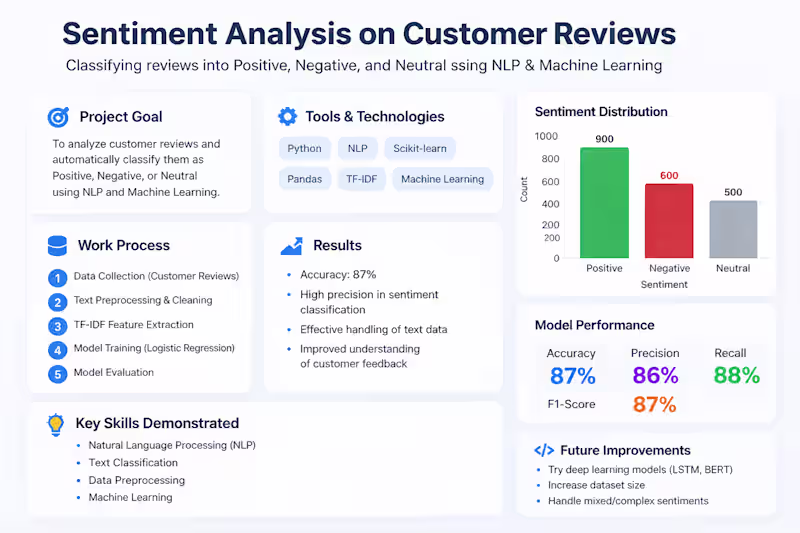
I worked on a Sentiment Analysis project where I classified customer reviews into positive, negative, and neutral categories. I performed text preprocessing, used TF-IDF for feature extraction, and applied a machine learning model to improve accuracy. This project helped me gain hands-on experience in NLP, data labeling, and model evaluation.
2
3
314
Message
0
Adi Sitoke
Data Entry & Management
0
5
Message
0
KD Singh
SEO That Delivers—Traffic, Leads, and Results Across The Globe!
0
0
Message
1
Micci micci
Taxi Fare Price Prediction Project
1
1
Message
4
Bulbul Gupta
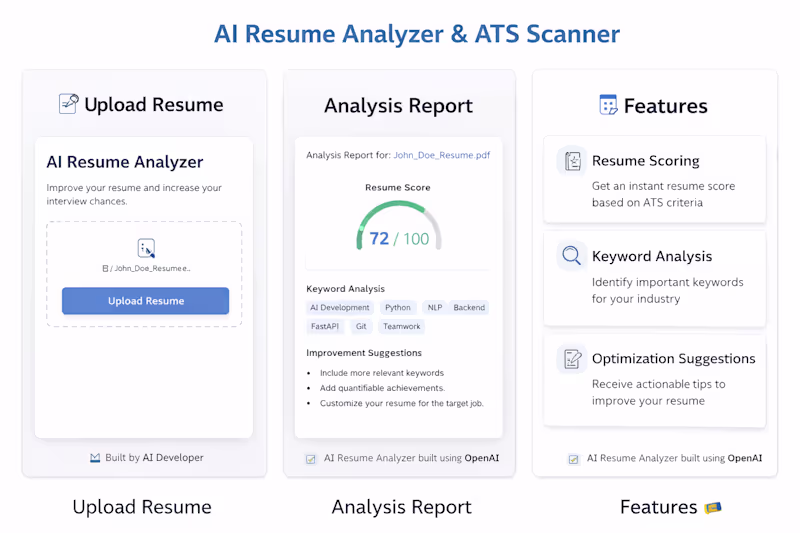
Built an AI-powered resume analyzer that evaluates resumes and provides instant feedback to improve job success rates. The system analyzes resume content, structure, and keywords using AI to generate a score and actionable suggestions. It helps users optimize their resumes based on industry standards and ATS (Applicant Tracking System) requirements. This tool is designed for job seekers and professionals to enhance their resumes and increase their chances of getting shortlisted. "Open to building similar AI-powered tools for businesses". 🚀
4
220
Message
0
Micci micci
Movie Recommendation Engine Development
0
2
Message
3
Bulbul Gupta
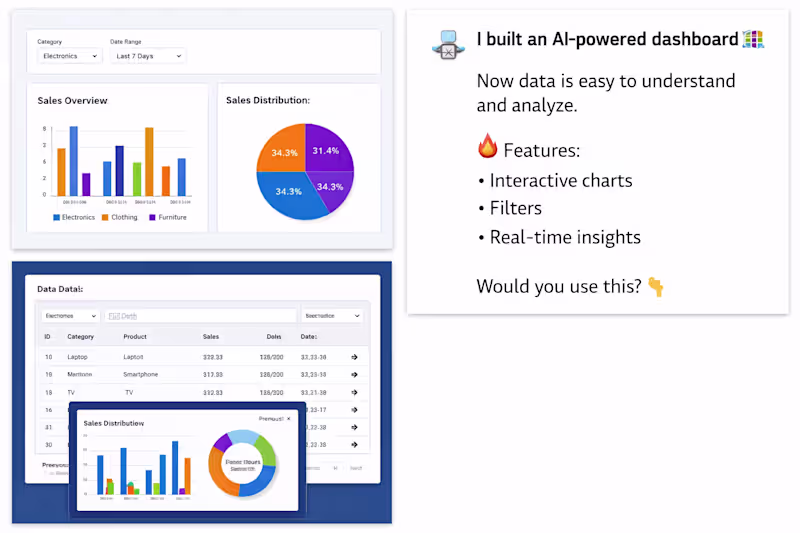
📊 I built an AI-powered data dashboard Now data is easy to understand and analyze. No more manual work ❌ Just filter → Get insights instantly ⚡ 🔥 Features: • Interactive charts • Smart filters • Real-time insights ⚙️ Tech: Python, Flask, PostgreSQL, Chart.js 💡 Perfect for: Businesses, analysts, startups 💬 Want a dashboard like this? DM me 🚀
3
172
Message
0
Micci micci
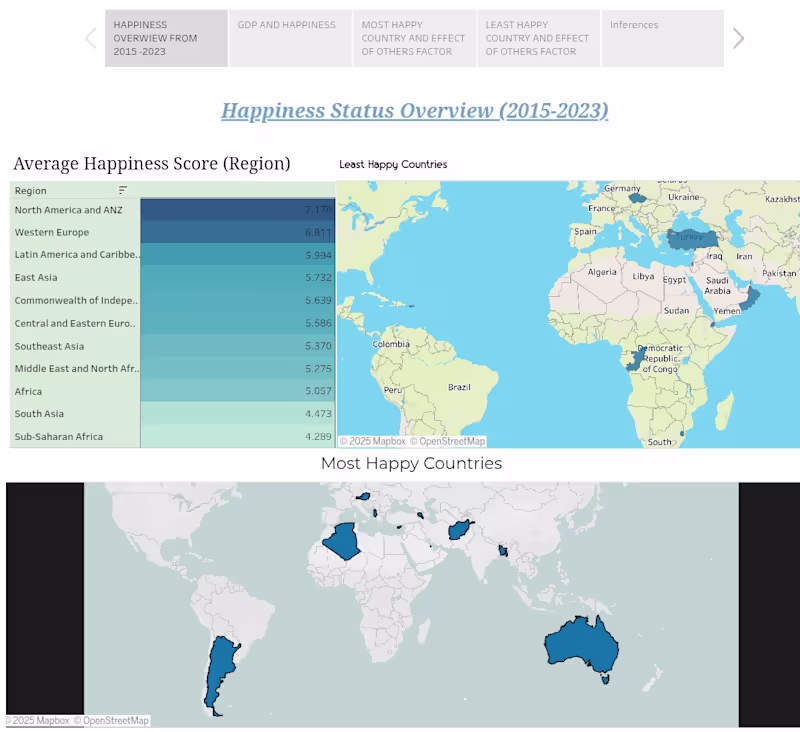
Interactive Dashboard for World Happiness Status
0
0
Message
2
Bulbul Gupta
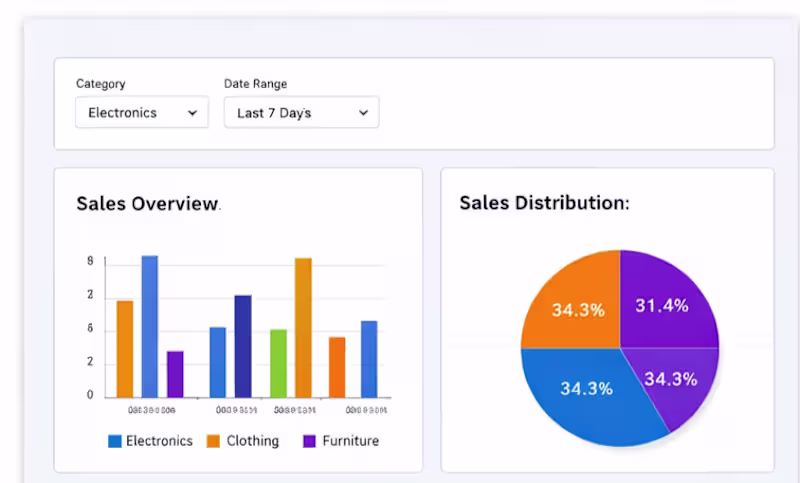
Built an AI-powered data visualization dashboard that helps users analyze and understand data easily through interactive charts and filters. The system fetches data from a database and displays it in real-time using dynamic charts and tables. Users can apply filters to explore specific insights and make better decisions. 💡 This solution is useful for businesses, analysts, and teams to track performance, monitor trends, and simplify complex data. 🔥 Key Highlights: • Interactive charts (bar, pie) • Dynamic data filtering • Real-time data updates ⚙️ Built using Python, Flask, PostgreSQL, and Chart.js. DM me
1
2
153
Explore projects