Data Engineering Projects in India
Data Engineering Projects in India
Sign Up
Post a job
Sign Up
Log In
Filters
2
Projects
People
Message
2
Denish Kukadiya
pro
Google Analytics Enhance Data Collection and Reporting
2
17
Message
3
Asif Farhan Khan
pro
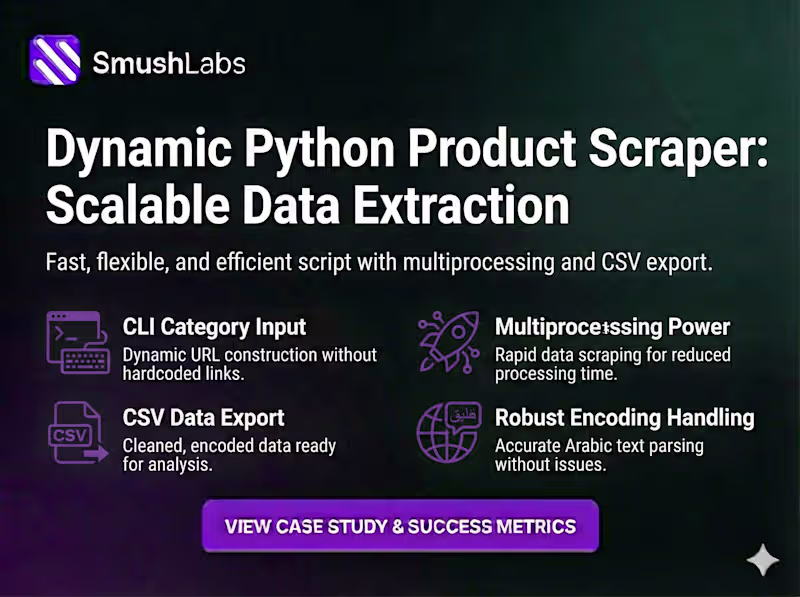
Data Scraping for an E-commerce Website
3
121
Message
0
Ajay Bidyarthy
pro
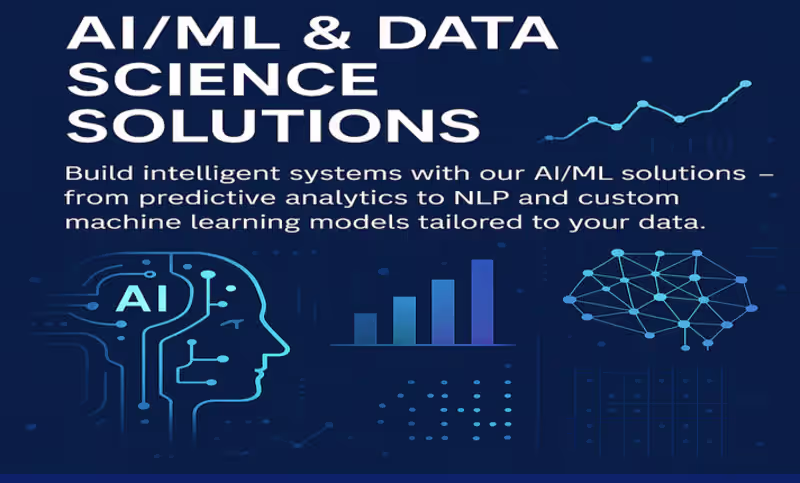
Title: AI App Development | LLMs, Chatbots, RAG & Automation Solutions Description: I design and develop intelligent AI-powered applications that automate workflows, enhance user experience, and unlock actionable insights. From custom chatbots to advanced LLM-based systems, I build scalable and production-ready solutions tailored to your business needs. Whether you're a startup looking to integrate AI or an enterprise aiming to optimize operations, I deliver robust, efficient, and future-ready AI systems. What I Offer: ✔Custom AI applications using LLMs ✔Chatbot development (GPT, Claude, RAG-based) ✔AI workflow automation (N8N, Zapier, Make) ✔API integrations and backend systems ✔AI SaaS product development Tech Stack: Python, FastAPI, LangChain, OpenAI, Claude, Supabase, PostgreSQL, React, Next.js, AWS
0
23
Message
1
Raj Kumar
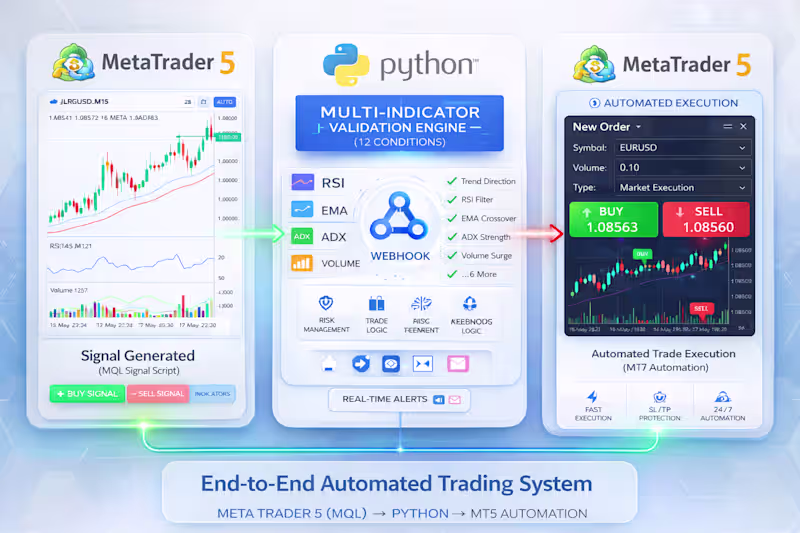
Developed an automated options trading bot using Python that executes trades on Deriv based on real-time strategy signals and multi-condition validation logic. The system is designed to operate continuously with minimal latency, ensuring fast and accurate trade execution in volatile market conditions. The bot integrates signal generation, validation, and execution into a single automated workflow. It evaluates multiple technical indicators, applies strict entry conditions, and triggers trades only when high-probability setups are detected. Key features include: • Fully automated options trading (Deriv API integration) • Real-time signal processing and execution • Multi-indicator validation logic for higher accuracy • Risk management controls and trade filtering • Continuous operation with minimal manual oversight • Scalable architecture for strategy customization This solution enables traders to automate their options trading strategies end-to-end, improving consistency, speed, and discipline while eliminating emotional decision-making.
1
104
Message
0
Oaz Shakti
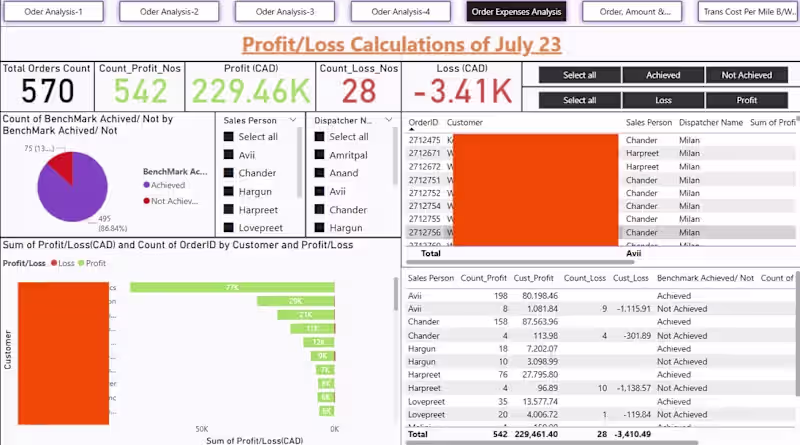
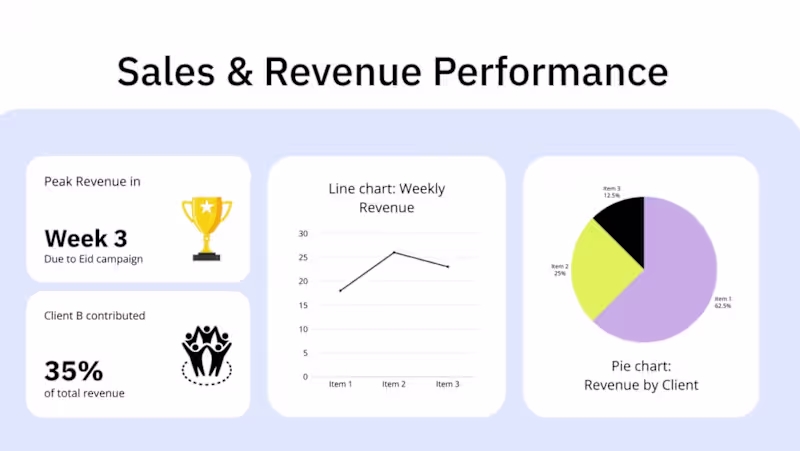
Dynamic Dashboard Created to analyse the profit / loss for a Canadian logistic firm, using this dashboard the CEO / Managers can get the complete details of the real time process / work going on:
0
50
Message
0
Aishwary Dhare
pro
Migration of ETL Pipelines to Apache Airflow
0
2
Message
3
Shivendra Singh Bhadauriya
Every business constantly monitors its numbers. One department that relies on them the most is the Marketing / Ads Tracking team. Marketing teams usually track performance across multiple platforms like Google Ads, Facebook Ads, Meta, and other channels. The challenge is that the data is often scattered, making it difficult to quickly understand overall performance. Great dashboards don’t just show data — they help businesses make smarter decisions faster. If your business is looking to build powerful Power BI dashboards for marketing, sales, or business analytics, feel free to connect with me. 📩 Open to Power BI projects #PowerBI #DataAnalytics #MarketingAnalytics #BusinessIntelligence #DashboardDesign
3
121
Message
0
Rajagopalan G
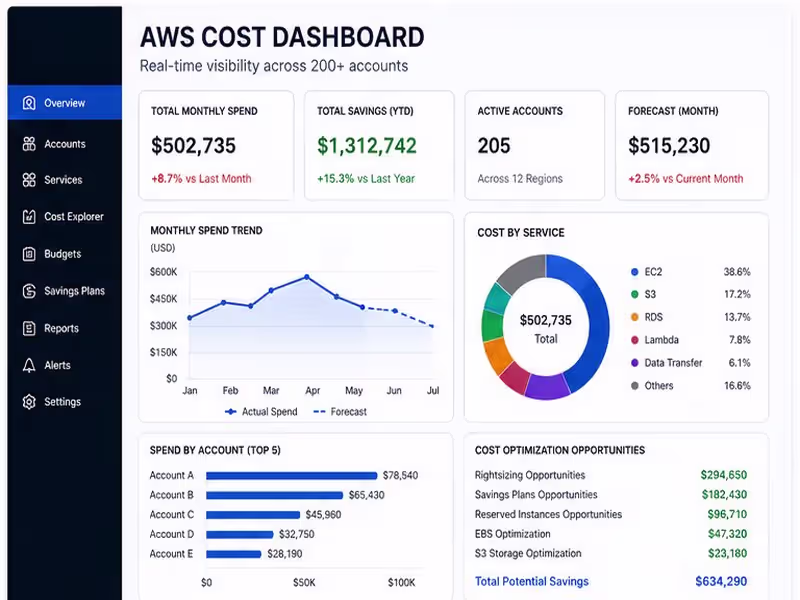
Designed and implemented an AWS cost dashboard for 200+ accounts to provide centralized spend visibility, service-wise breakdown, monthly trends, forecasting, and business-unit level reporting. Replaced manual Excel reporting with automated, interactive analytics dashboards.
0
11
Message
0
PADMANAVA PARUI
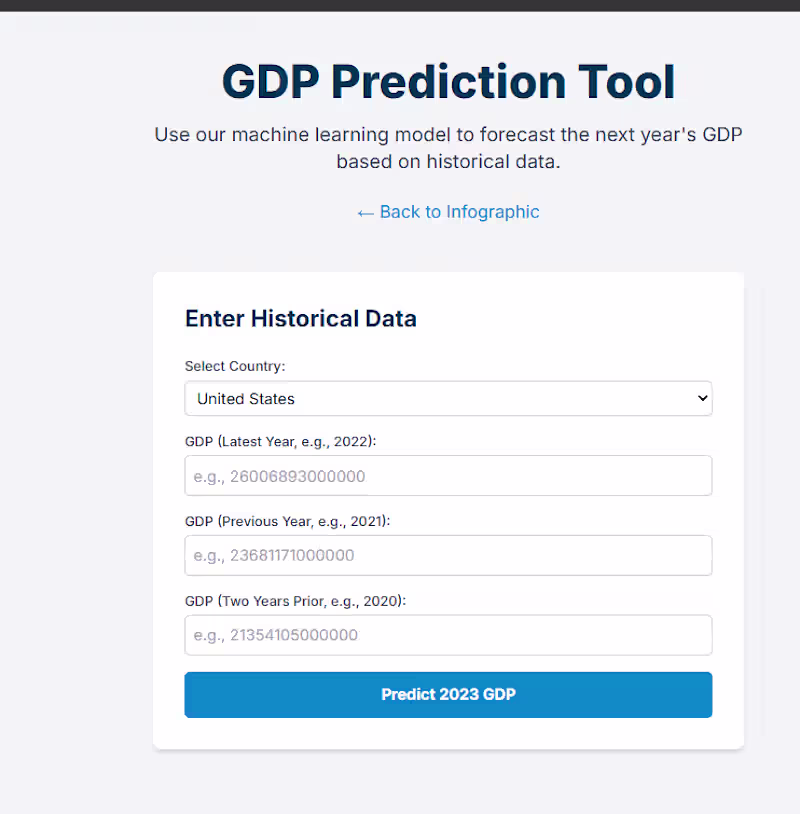
Economic Intelligence Dashboard: Predictive Modeling & Real-Time Visualization: Architected a high-fidelity full-stack platform designed to aggregate and visualize macroeconomic indicators from the World Bank Open Data API. This project combines live data orchestration with machine learning to provide predictive insights into global GDP, inflation, and labor trends. Technical Deep-Dive: Data Pipeline: Engineered a Python/Flask backend to normalize and serve real-time macroeconomic data, ensuring consistent data structures across diverse international sources. Predictive Analytics: Implemented a regression-based forecasting tool that utilizes historical time-series data to project future GDP growth with interactive user-input variables. Geospatial & Statistical UI: Developed a responsive frontend using React and Leaflet.js, featuring dynamic map hotspots and complex statistical overlays using Plotly. Insight-Driven Design: Optimized the platform for data storytelling, allowing users to reveal hidden correlations between variables like inflation and unemployment through interactive scatter plots.
0
27
Message
0
Jayant Sao
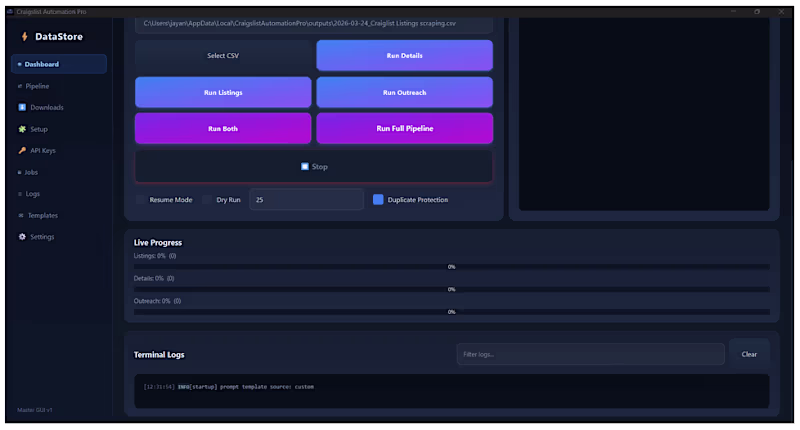
AI Craigslist Scraper & Outreach Automation I developed a custom Craigslist automation software (.exe) for a real client to automate lead generation, email outreach, and CRM integration into a fully streamlined workflow. This solution was built to save time, increase outreach efficiency, and manage leads automatically without manual effort. 🔹 Project Workflow: • User inputs a Craigslist search listing URL • The software automatically scrapes all listing links • Each listing is opened one by one to extract email addresses • Listing details such as Title, Description, and Address are collected • Data is processed using the OpenAI API to generate personalized emails • Contacts are automatically created in Go High Level (GHL) CRM • Emails are sent using GHL SMTP • Email tracking and reply handling are managed inside GHL 🔹 Key Features: ✔ Craigslist listing scraping automation ✔ Email extraction from listings ✔ AI-powered personalized email generation ✔ Go High Level CRM integration ✔ SMTP-based automated email sending ✔ Email tracking and reply management ✔ Standalone Windows (.exe) software ✔ Built for real-world business automation 🔹 Project Type: Custom-built automation software developed for a real client to automate large-scale outreach and lead management.
0
36
Message
0
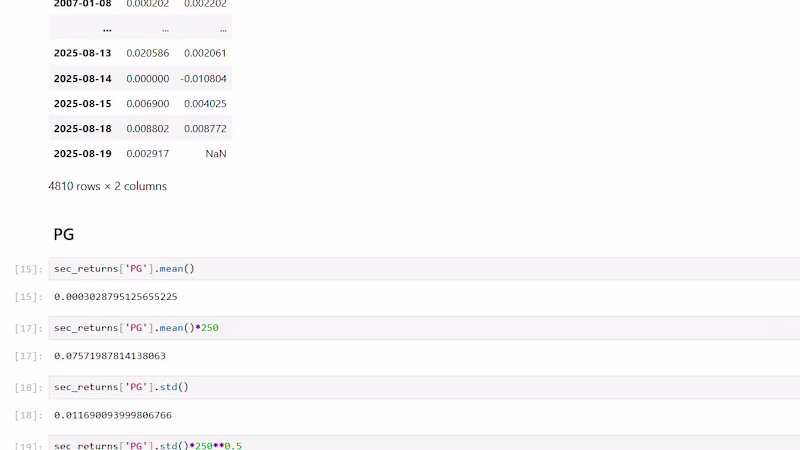
Aditya Singh
Role: Quantitative Developer Description: Built a custom Python toolkit designed for automated stock return analysis and risk-reward plotting. This project streamlines the portfolio management process by visualizing technical indicators and identifying optimal entry/exit points based on historical data. Tools: Python, Matplotlib, SQL. Impact: Automated the generation of technical reports, replacing 4+ hours of manual spreadsheet work.
0
8
Message
0
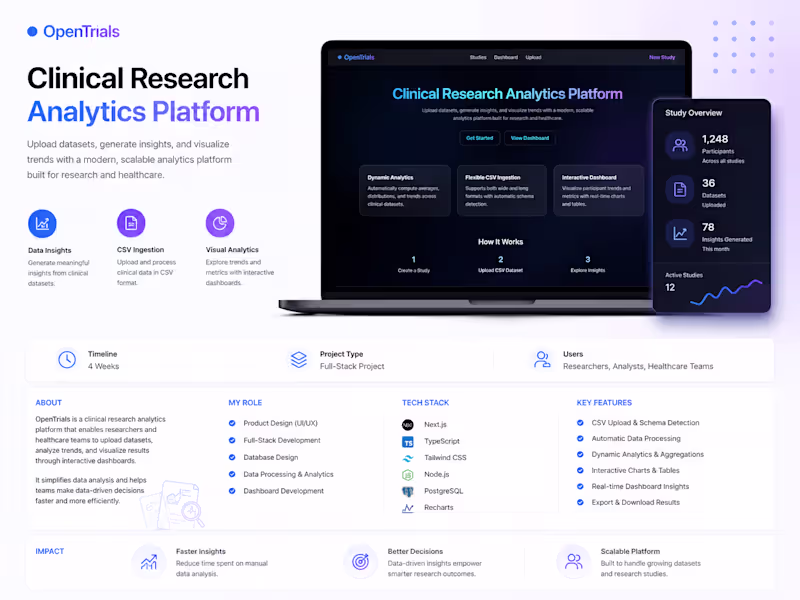
Aryan Lodha
Built a full-stack clinical analytics platform enabling schema-agnostic data ingestion and real-time insights for scalable research analysis.
0
12
Message
0
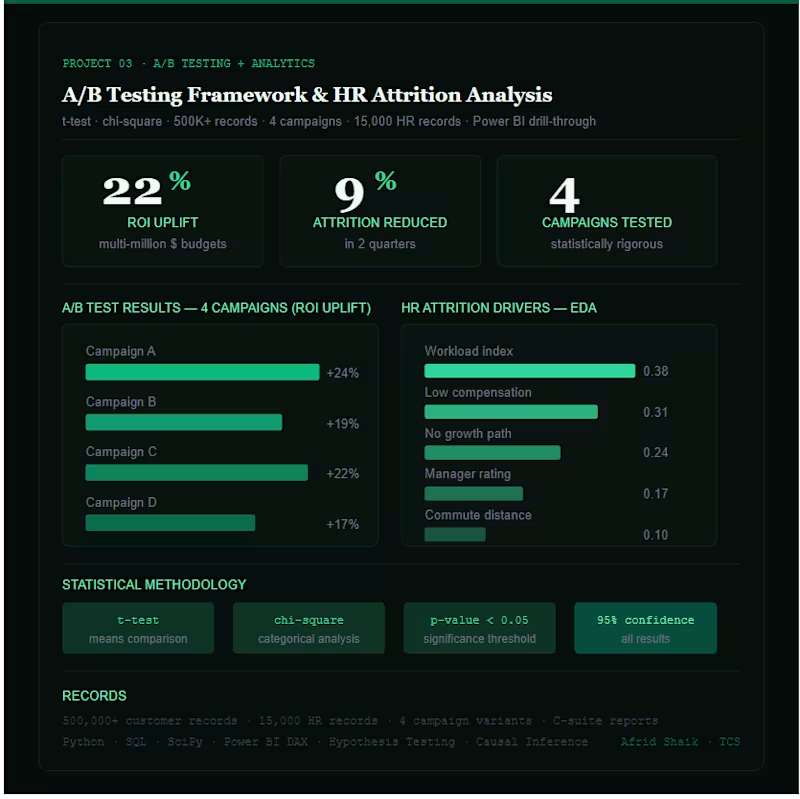
AFRID SHAIK
Customer Churn Prediction, Retail Demand Forecasting,A/B Testing & HR Attrition Analysis
0
24
Message
2
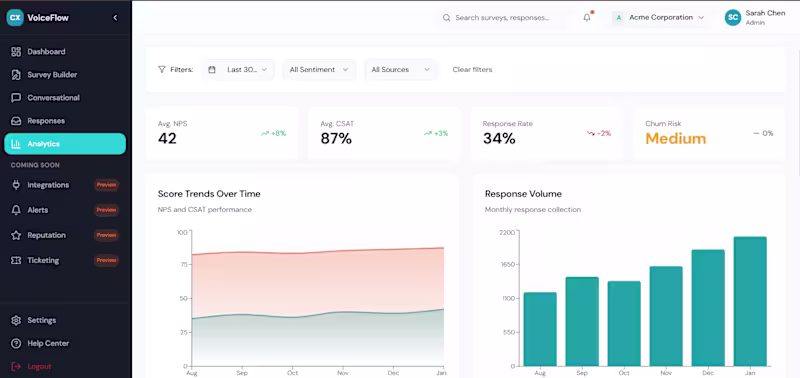
Kushagra Agrawal
Built a B2B survey platform MVP with chat-style surveys, feedback forms, analytics dashboards, and AI-based sentiment and topic insights.
2
2
174
Message
3
ANIMESH SINGH
Problem: Many organizations still process invoices manually by reading PDF documents and entering key details (invoice number, vendor, amount, etc.) into systems. This process is slow, error-prone, and difficult to scale, and it also makes it harder to detect duplicate invoices or incorrect totals. Solution: This project builds an automated invoice processing pipeline that converts uploaded invoice PDFs into structured data. It uses OCR to extract text, LLMs to identify invoice fields, validation checks to ensure correctness, and Kafka-based event streaming to manage the processing pipeline. The extracted data is stored in PostgreSQL and visualized through a dashboard, enabling faster, scalable, and more reliable invoice processing.
3
3
103
Message
1
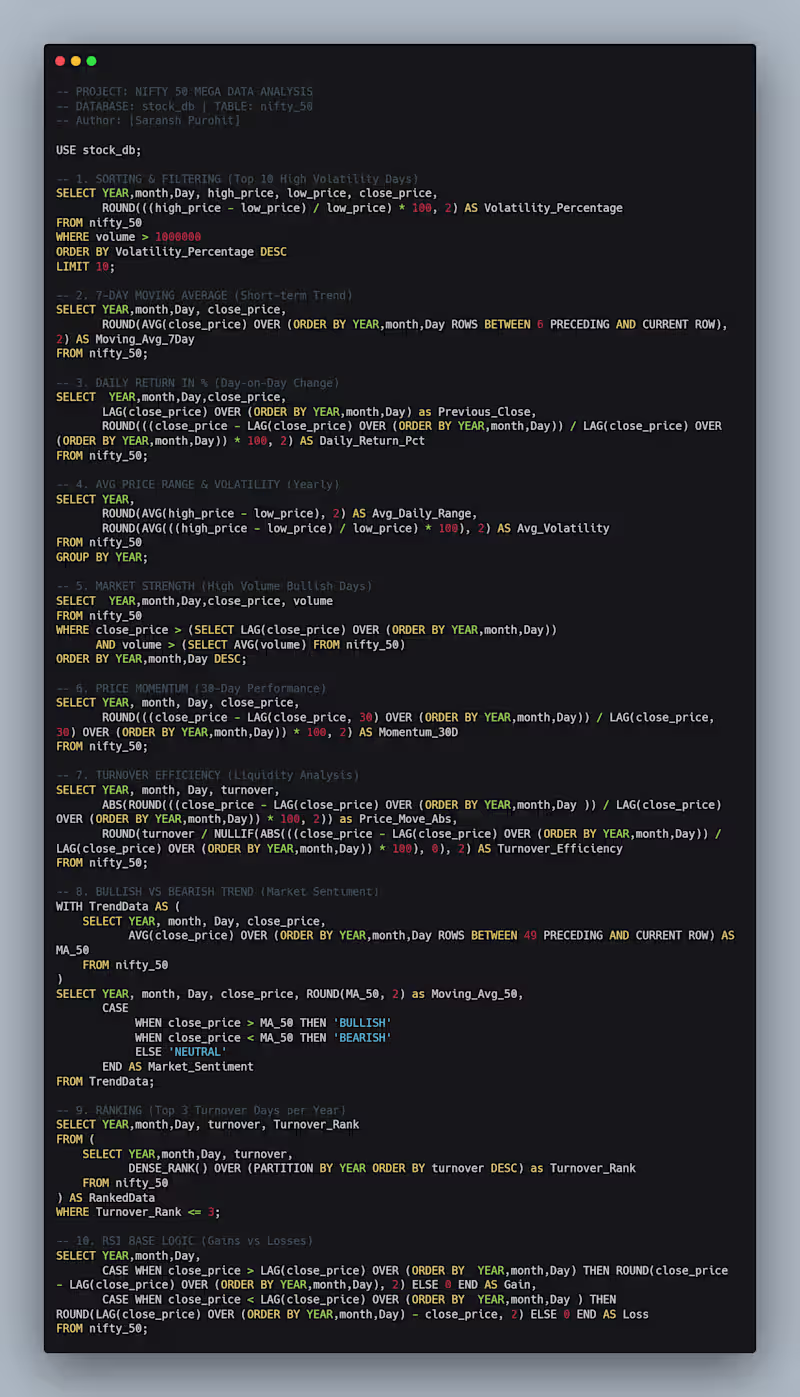
Saransh Purohit
In this technical deep-dive, I engineered a robust SQL script to extract high-level financial insights from 20+ years of Nifty 50 data. I moved beyond basic queries to implement complex analytical functions that simulate real-world market tracking. Market Sentiment Logic: Developed a CASE-based classifier to identify Bullish/Bearish trends using 50-day Moving Averages. Volatility & Risk: Calculated day-on-day price fluctuations and ranked high-risk trading days. Momentum Tracking: Integrated window functions (LAG/LEAD) to compute RSI-base logic and 30-day price momentum. Efficiency Metrics: Analyzed Turnover Efficiency to understand market liquidity during peak trading hours. This project demonstrates my ability to handle large-scale financial datasets and translate raw numbers into strategic market indicators.
1
46
Explore projects