
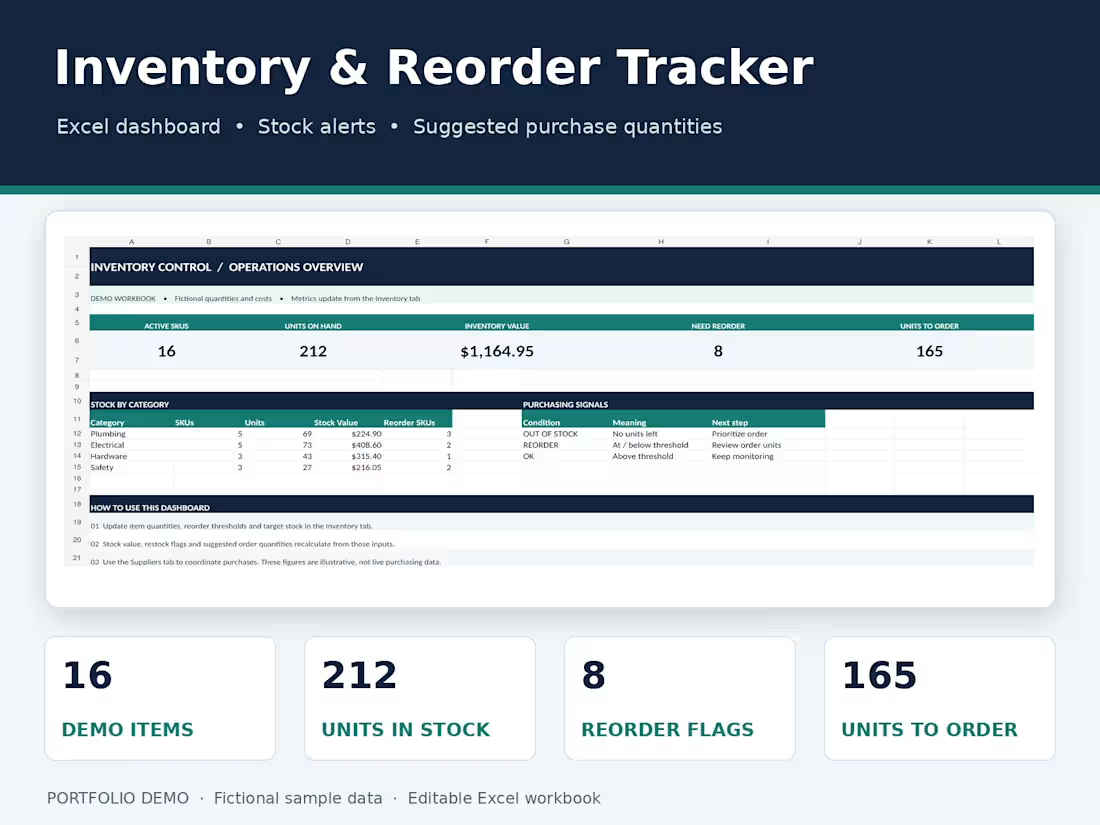
Inventory & Reorder Tracker | Excel Dashboard
An Excel-based inventory management system designed for small businesses that need a simple way to track stock and plan purchases.
Features include:
Product and inventory tracking
Automatic low-stock and out-of-stock alerts
Suggested reorder quantities
Inventory value calculations
Supplier information and stock summaries
The dashboard updates automatically when inventory information changes, helping business owners make better purchasing decisions.
Portfolio demonstration using fictional business data. Not a paid client project.
0
21

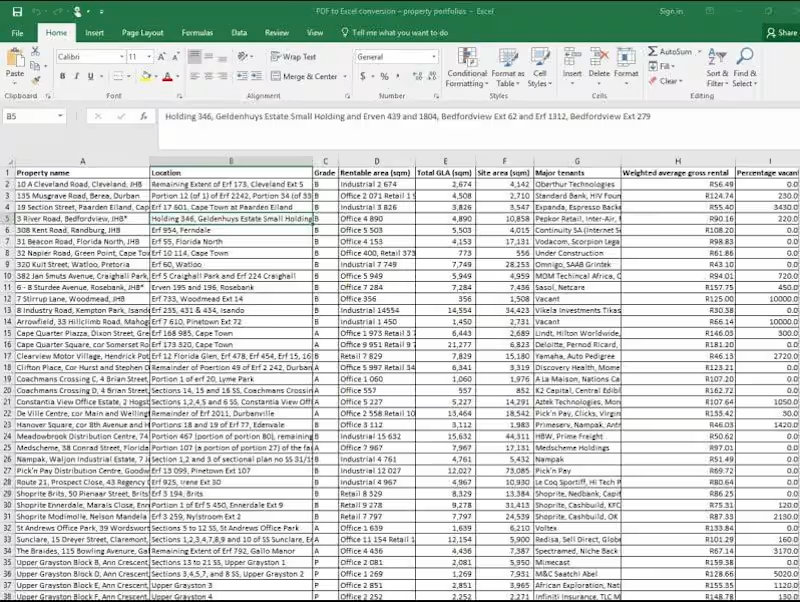
I enjoyed working on this spreadsheet project because it gave me the opportunity to organize detailed financial data into a clear and easy-to-read format.
The project involved managing information such as stock names, symbols, shares, purchase prices, cost basis, current prices, market values, gains and losses, dividends, and annual yields. I appreciated the importance of keeping the data organized and consistent so the information could be reviewed quickly and easily.
This project demonstrates my attention to detail, data organization, and ability to create clean, structured spreadsheets. I enjoy taking detailed information and turning it into an organized resource that is easy to understand and use.
#DataEntry #MicrosoftExcel #SpreadsheetManagement #DataOrganization #AttentionToDetail
0
21

I drove data-backed decisions across the supply chain, product development, and executive reporting functions. Early on, I conducted comprehensive market and supplier research—building automated pricing models to benchmark vendors and calculate cost variances. When tasked with stepping up to independently manage inventory and vendors, I engineered a suite of automated forecasting tools and dashboards using Excel, Google Sheets, VLOOKUP, and BigCommerce data. These tools visualized real-time production status (W3s), predicted imminent stock-outs using color-coded heatmaps, and tracked high-volume sales. I synthesized this complex operational data into three streamlined, daily dashboards presented directly to the CEO, while also modeling emergency sourcing scenarios to ensure we maintained 100% order fulfillment during production delays.
0
103


