Data Visualization Projects in Harīpur
Data Visualization Projects in Harīpur
Sign Up
Post a job
Sign Up
Log In
Filters
2
Projects
People
3
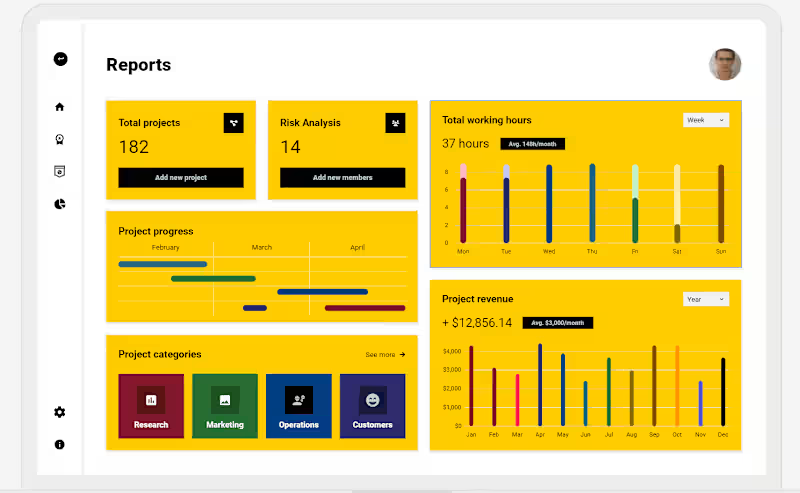
Ullah Atta
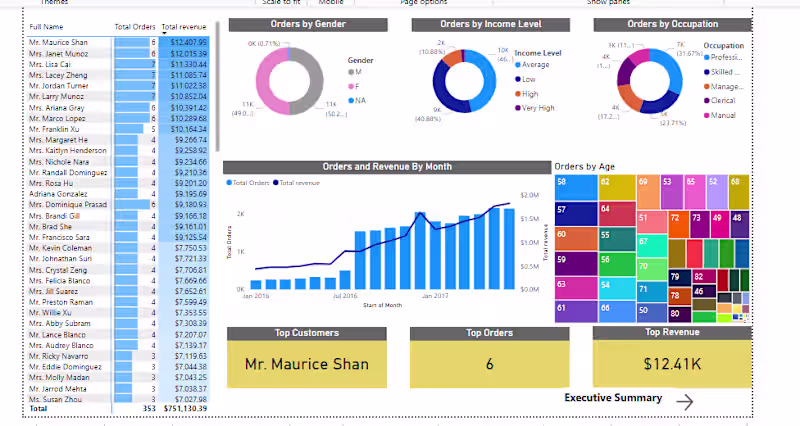
Project Title: Sales Performance Dashboard Using Power BI Description Example: Designed an interactive Power BI dashboard to track sales performance, revenue trends and monthly KPIs. Automated data transformation using Power Query and built dynamic Excel models for reporting accuracy. Tools Used: • Microsoft Excel • Power Query • Power BI
4
3
110
0
Hammad Tariq
Google Data Pipeline
0
17
0
Atif Abbasi
atifab910/Data-Science-Project
0
4
0
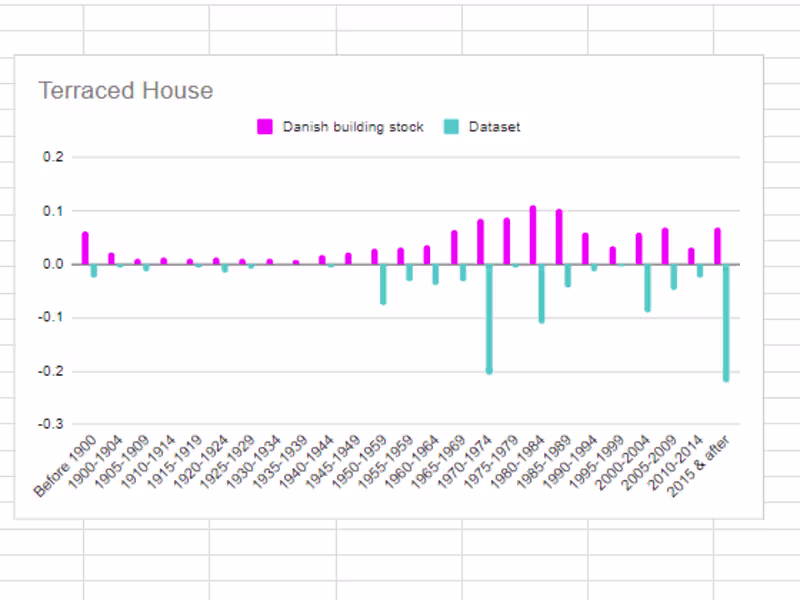
Muhammad Bakhtiar Salik
Heater Use
0
3
0
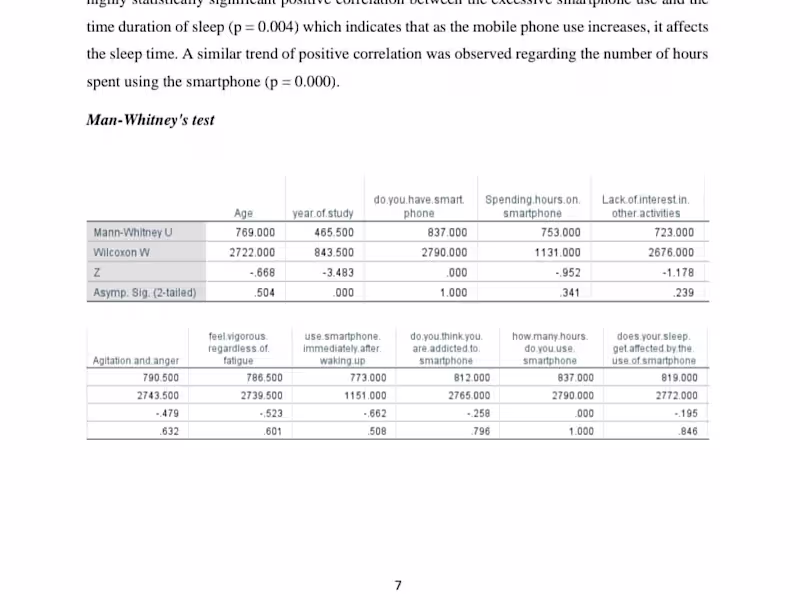
Ameena Riaz
Data Analysis by applying man whitney's test
0
18
0
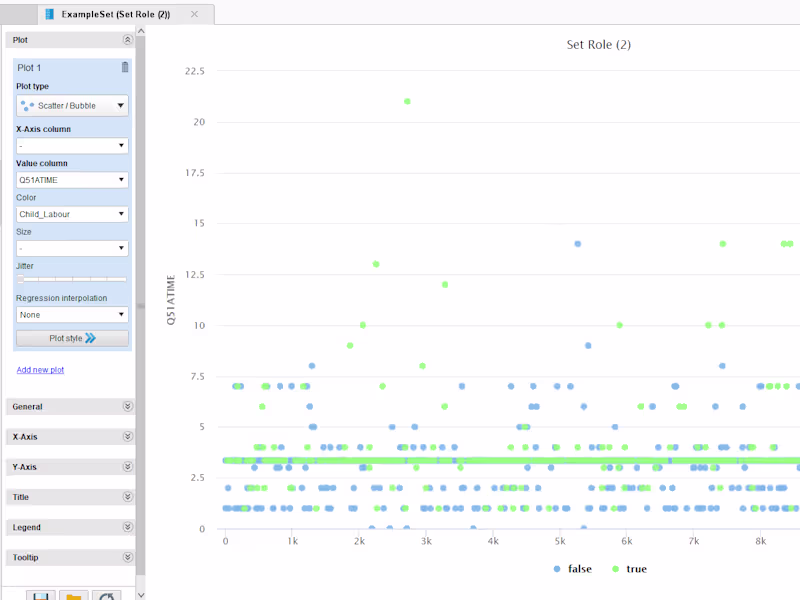
Haider khan
Child Labor Risk Analysis
0
4
0
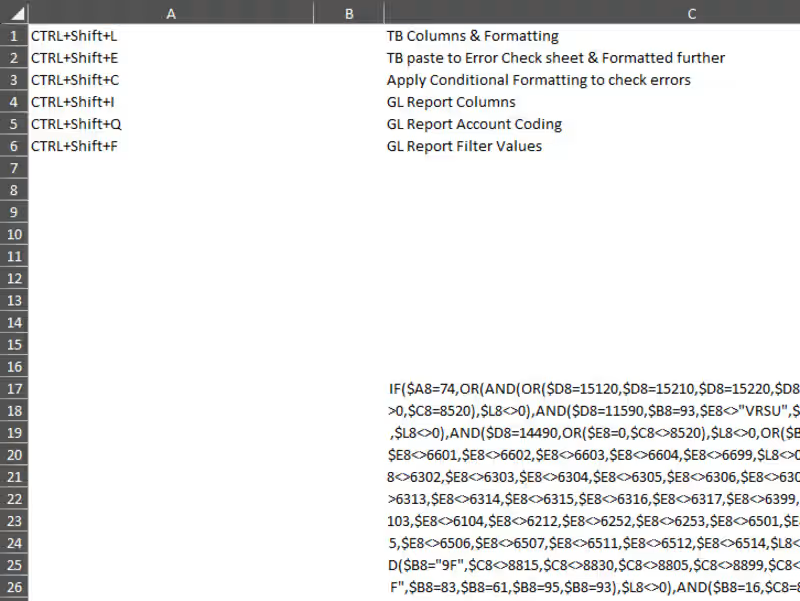
Abdul Wahab Abdul Qadees
Automated data conversion from CSV file to Excel
0
0
0
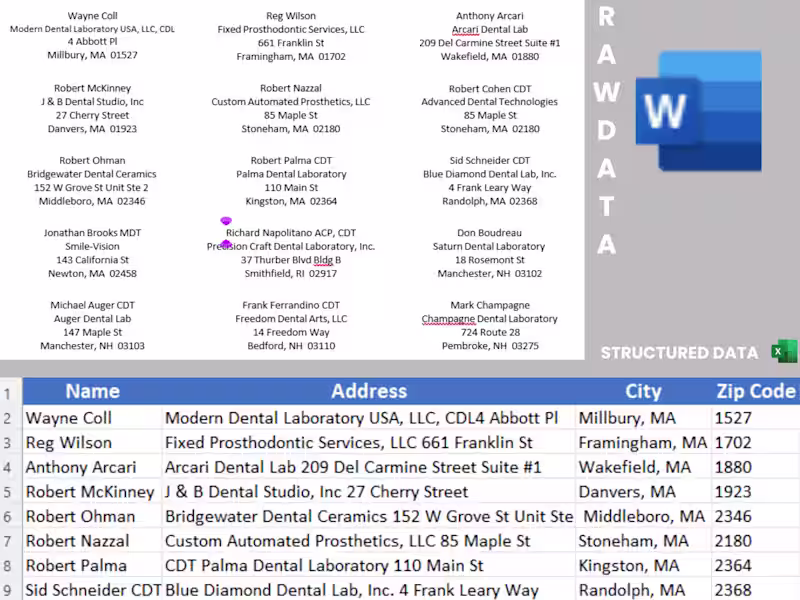
Afaq Khan
Convert a RAW unorganized pdf file into structured excel sheet
0
6
0
Vector xdev
Discord Bot for job applications
0
24
2
Shehzada Ammad Ali
pro
Human Resource Intelligence Chatbot with SQL-Driven Data Visualization I developed an AI-powered HR chatbot that transforms natural language queries into actionable insights through SQL-driven analytics and automated visualizations. How It Works: HR asks questions in plain English AI generates/executes SQL queries Processes workforce data Outputs structured results or charts Key Features: Natural language to SQL conversion Real-time workforce analytics Automated data visualization Scalable integration with HR databases Extendable to other chart types
2
156
0
Usman Ali | zyp
Financial Risk Analysis Model for Informed Investment Decisions
0
11
0
Hammad Tariq
Dashboard Migration
0
17
0
Muhammad Bakhtiar Salik
ICE Cream Shop Sales By Bakhtiar
0
5
0
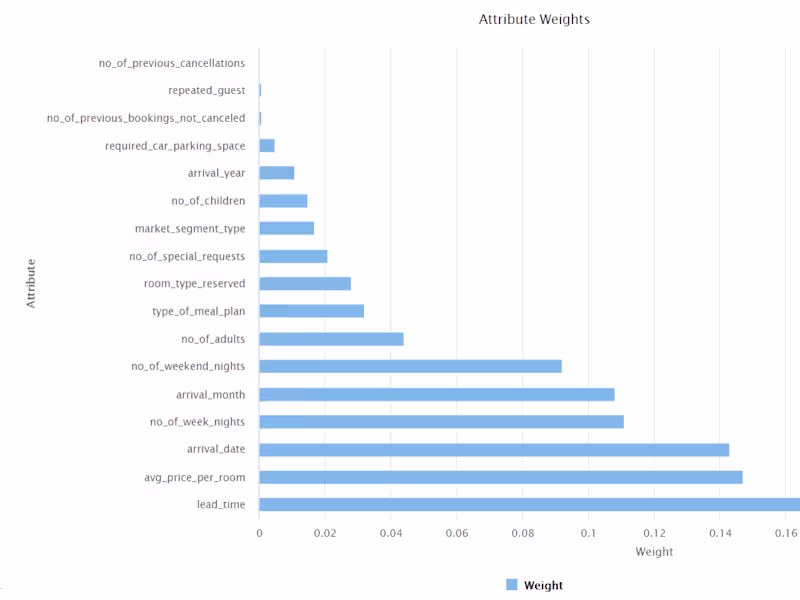
Haider khan
Predictive Analysis for Hotel Booking Cancellations
0
3
0
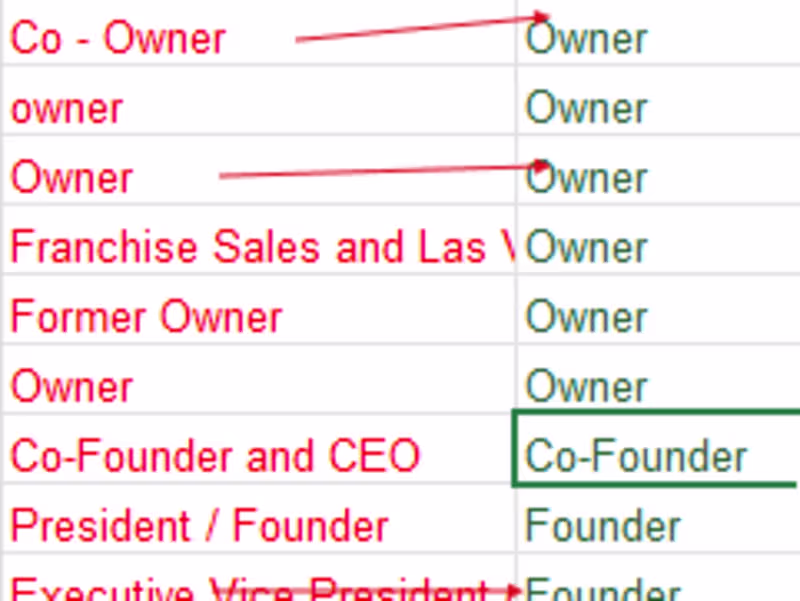
Abdul Wahab Abdul Qadees
Cleansing of data, for further clarity and Digital Marketing use
0
1
0
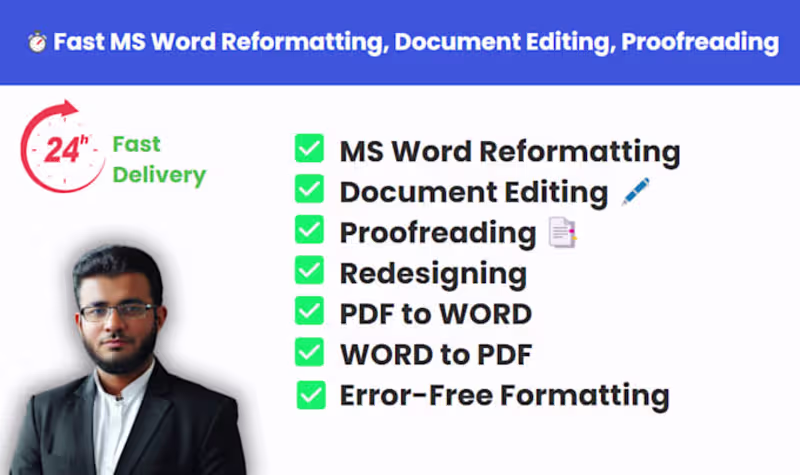
Afaq Khan
Convert Raw WORD Doc to Structured Excel file
0
2
Explore projects