Power BI Data Analyst + ML AI Automation Expert
- 5.0
- Rating
- 102
- Followers
Power BI Data Analyst + ML AI Automation Expert
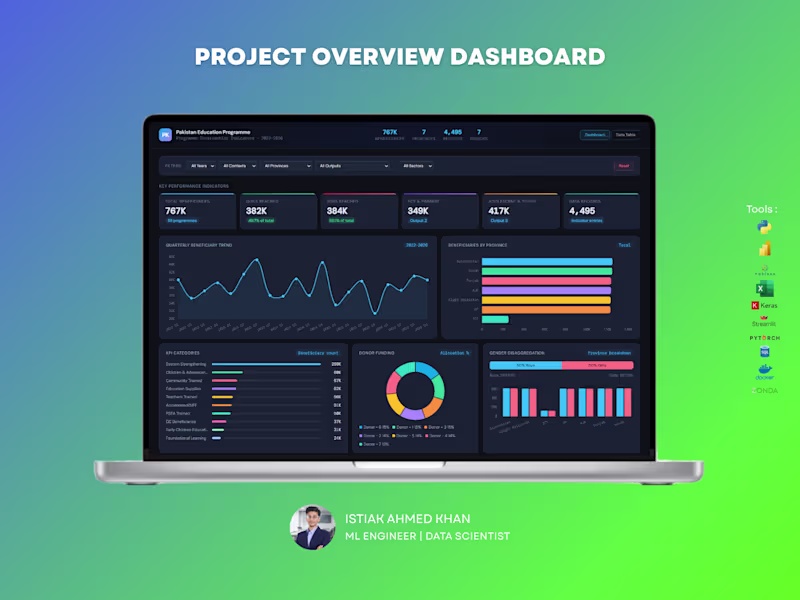
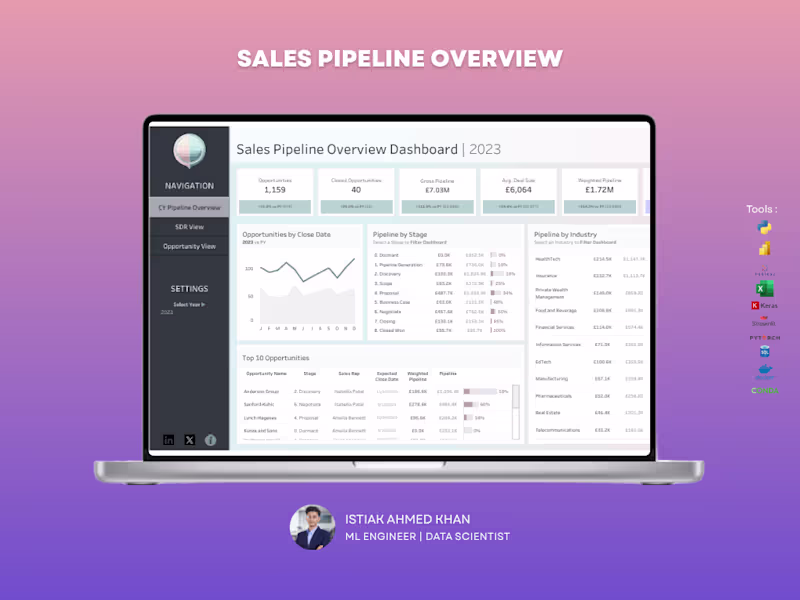


Data analyst | Python | SQL | Tableau | Excel | Power BI
Data analyst | Python | SQL | Tableau | Excel | Power BI
Stunning Visual Designer & Digital Marketer
Stunning Visual Designer & Digital Marketer


Frontend Engineer & Data Specialist
Frontend Engineer & Data Specialist


View more →