Projects using Streamlit in DhakaProjects using Streamlit in DhakaEducation Program Analytics Dashboard – Data Analytics Solution
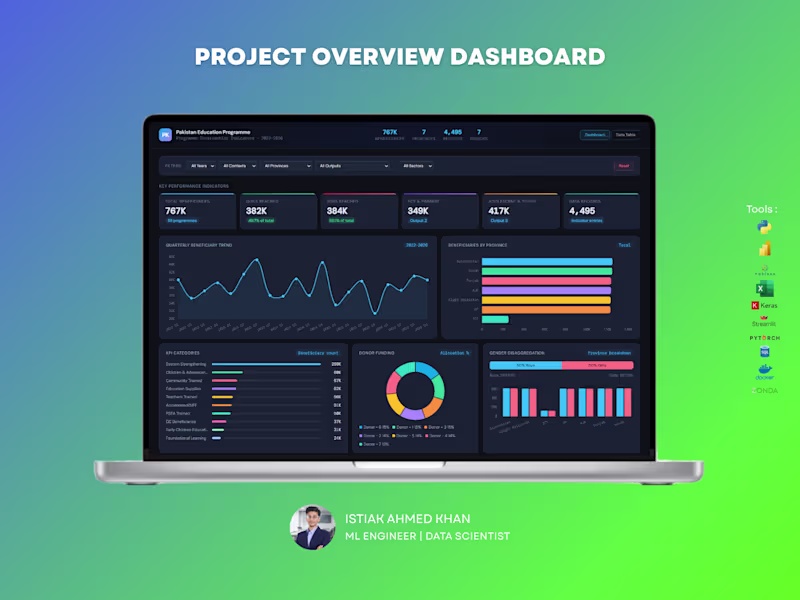
Handling large-scale program data without clear visibility can make impact measurement difficult. This dashboard is designed to give organizations a complete, real-time view of program performance, reach, and funding — all in one place.
What You Get :
A powerful, interactive dashboard that helps track beneficiaries, program outputs, regional performance, and donor contributions with clarity and precision.
Key Capabilities:
Monitor total beneficiaries and gender distribution
Track program reach across provinces and sectors
Analyze quarterly trends and growth patterns
Evaluate donor funding allocation and impact
Identify top-performing program categories and outputs
Explore education level distribution and engagement
For NGOs and large programs, data is critical for decision-making and reporting. This dashboard helps you measure impact, improve transparency, and optimize resource allocation — making your data meaningful and actionable.
Perfect For :
NGOs and non-profit organizations
Government programs
International development agencies
Research and policy teams
If you want a professional, insight-driven dashboard that clearly communicates impact and performance, I can create a customized solution tailored to your organization. Predictive Marketing Analytics: Optimizing Advertising ROI
1. The Business Problem
Companies often struggle to determine which marketing channels actually drive revenue. Without a data-driven approach, advertising budgets are often misallocated across platforms like TV, Radio, and Newspapers, leading to inefficient spending and missed sales targets. This project aimed to build a predictive model to quantify the relationship between multi-channel marketing spend and total sales.
2. Strategic Insights & Market Analysis
Through a rigorous analysis of historical advertising data, I identified the specific drivers of revenue growth:
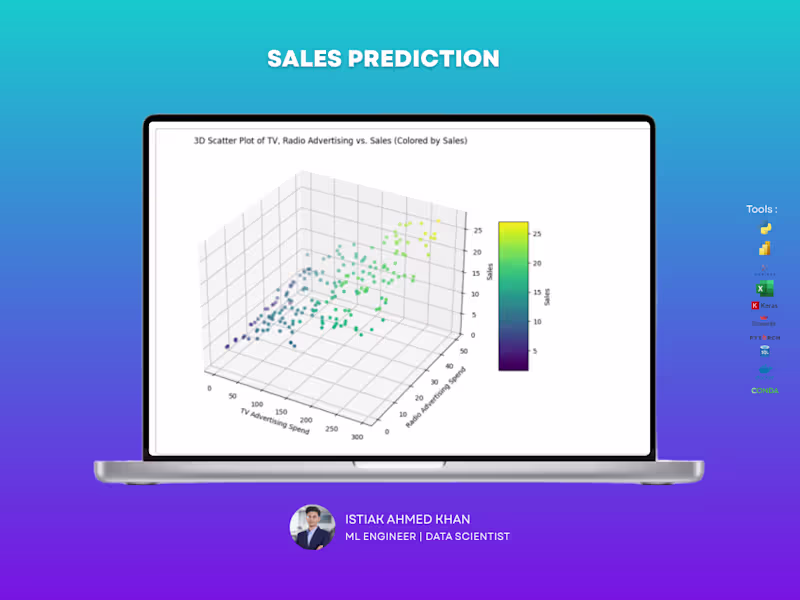
Dominant Revenue Driver: TV advertising emerged as the most critical factor, showing a massive 0.9 correlation with sales.
Efficiency Analysis: While Radio and Newspaper spending contributed to the marketing mix, their direct impact on sales was significantly lower (0.35 and 0.16 correlation, respectively), suggesting a need for budget reallocation.
Predictive Power: My analysis revealed that 81.6% of the variance in sales can be explained by TV advertising spend alone, providing a highly reliable foundation for future budget forecasting.
3. Data-Driven Solution
I developed a Linear Regression model to provide leadership with a mathematical framework for sales forecasting.
Reliability: The model was validated using a 70/30 train-test split, ensuring it performs accurately on new, unseen market data.
Accuracy: The system achieved a strong R-squared value of 0.79 on the test set, meaning it can accurately predict nearly 80% of sales fluctuations based on planned marketing spend.
Error Management: I performed a detailed residual analysis to confirm that the model’s error terms were normally distributed, ensuring the reliability of the forecasted figures.
4. Business Impact
Budget Optimization: Provided a clear mathematical equation (Sales=6.948+0.054×TV) that allows the marketing team to calculate the expected return on every dollar spent on TV advertising.
Strategic Planning: Enabled the transition from "gut-feeling" marketing to precision budgeting, allowing the company to maximize ROI by prioritizing high-impact channels.
Risk Mitigation: By identifying the variance that the model couldn't explain, I helped the business identify where external market factors might still influence sales, allowing for more conservative and realistic financial planning.
Technical Stack
Modeling: Simple Linear Regression, Statsmodels (OLS), Scikit-learn.
Analytics: Python, Pandas, NumPy.
Visualization: Seaborn, Matplotlib, 3D Scatter Plots End-to-End Machine Learning Pipeline for Telecom Customer Churn
1. The Business Problem
Customer churn is a major challenge for telecommunications companies, driven by competition, service issues, and changing consumer preferences. This project was designed to transition the company from reactive support to proactive retention using data-driven strategies such as customer segmentation, personalized offers, and loyalty programs,.
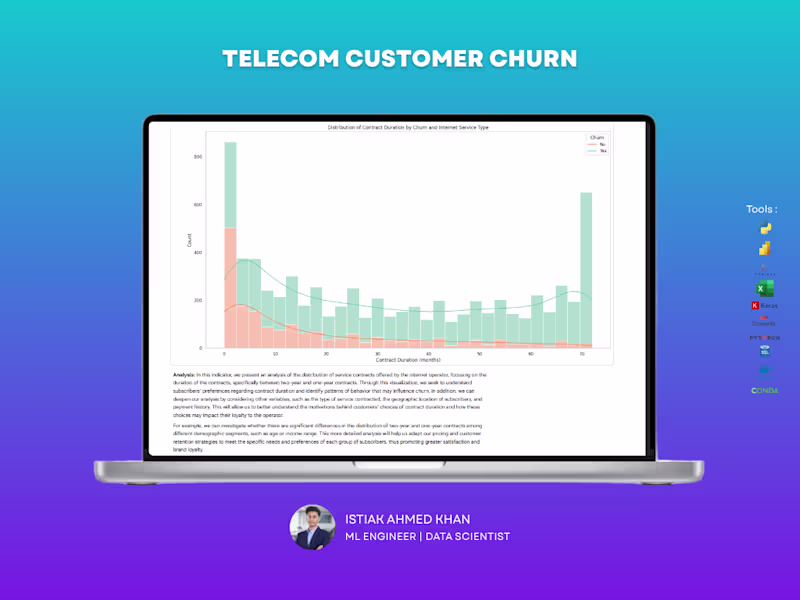
2. Data Exploration & Insights (EDA)
I performed a comprehensive descriptive analysis on a database of 7,043 customers with 21 distinct variables,. Key findings included:
Contractual Risk: Customers on month-to-month contracts showed significantly higher churn compared to those on one- or two-year commitments,.
Service Preference: While Fiber Optic plans were the most popular, they also represented a critical segment for monitoring due to their higher price points,.
Financial Indicators: Churned customers had a higher average monthly charge of $74.44, compared to $61.27 for retained customers.
Payment Behavior: The "Electronic Check" payment method was most strongly associated with service cancellation,.
3. Engineering & Preprocessing Pipeline
To prepare the data for high-performance modeling, I implemented a rigorous preprocessing workflow:
Data Cleaning: Removed irrelevant identifiers like customerID and addressed potential data quality issues. The dataset was verified to have zero missing or NaN values,.
Feature Engineering: Applied Label Encoding to transform categorical text variables into a numerical format suitable for machine learning algorithms,.
Data Splitting: Adopted a standard 80/20 train-test split to ensure the model could generalize effectively to unseen data,.
4. Model Development & Benchmarking
I developed and benchmarked eight distinct machine learning algorithms to identify the most effective solution for this specific application:
Linear & Probabilistic: Logistic Regression, Naive Bayes.
Tree-Based: Decision Tree, Random Forest.
Boosting Frameworks: AdaBoost, Gradient Boosting, XGBoost, and LightGBM,.
5. Performance Evaluation & Results
Models were evaluated using ROC curves, confusion matrices, and detailed classification reports,.
Winner: Logistic Regression achieved the highest accuracy at 81.83%,.
Secondary Performers: Gradient Boosting (81.05%) and AdaBoost (80.98%) also showed strong predictive power.
6. Technical Conclusion
This data-driven approach proves that proactive churn prediction is essential for business sustainability. By identifying that customers prioritize high-speed fiber optic services but are sensitive to pricing and contract terms, the company can now optimize its pricing and retention strategies to maximize user satisfaction and revenue. Sentiment-Driven E-commerce Optimization: Amazon Review Analysis & Rating Prediction.
Project Overview ✅
This project serves as a machine learning proof of concept designed to transform raw Amazon product reviews into actionable business insights. By automating the prediction of review ratings and analyzing customer sentiment, the system enables brands to optimize product listings, proactively address customer pain points, and drive higher conversion rates.
Process ✅
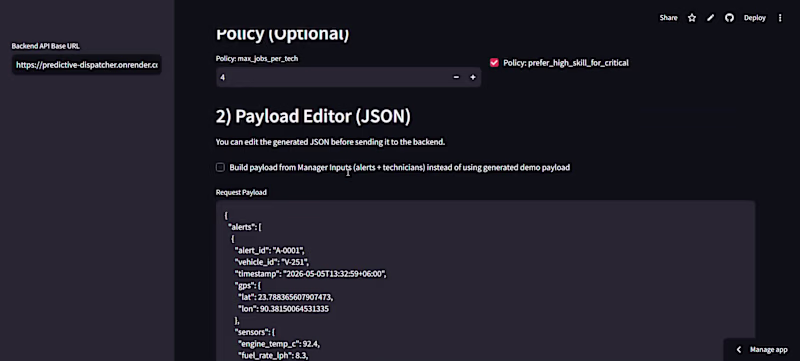
I developed an end-to-end pipeline covering data acquisition, complex text processing, and model deployment. Automated Data Scraping, Integrated the Apify API to extract real-time customer feedback directly from Amazon product URLs. I configured the scraper to handle up to 100 reviews per run, capturing critical metadata including rating scores, review descriptions, and verified purchase status.
Data Refinement & Feature Engineering:
Cleaned a dataset of approximately 1,944 reviews by removing noise (punctuation/symbols) and stop words using NLTK. I implemented TF-IDF Vectorization to convert text into numerical features and applied SMOTE (Synthetic Minority Over-sampling Technique) to address class imbalance, ensuring the model could accurately predict rare negative reviews.
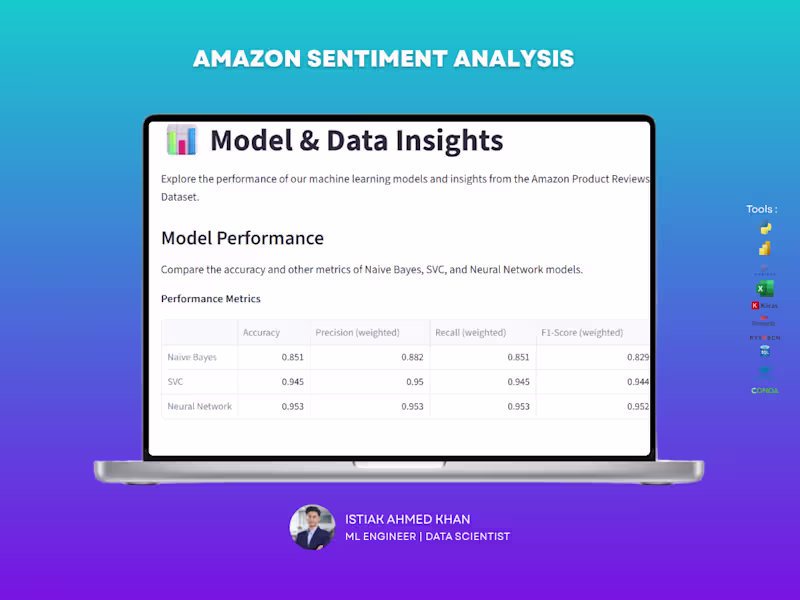
Model Benchmarking ✅
Developed and compared three distinct architectures to identify the most robust predictor:
Naive Bayes: High-speed probabilistic classification.
Support Vector Classifier (SVC): Optimized for high-dimensional text data.
Neural Network (MLPClassifier): To capture complex semantic patterns.
Web App Deployment: Built a dedicated Streamlit dashboard that allows non-technical stakeholders to input raw review text and receive instant rating predictions with confidence scores.
Technical Stack✅
Languages & Tools: Python, Apify Client.
ML & NLP Libraries: Scikit-learn (SVC, Naive Bayes, MLP), NLTK (Tokenization, Stopwords), Imbalanced-learn (SMOTE).
Deployment: Streamlit, Joblib (Model Serialization).
Visualization: Plotly, WordCloud, Matplotlib.
Key Results ✅
Achieved a peak accuracy of 95.27% using the Neural Network model, with the SVC model following closely at 94.46%.
Developed sentiment-based feedback loops within the app: high ratings (4-5 stars) trigger positive marketing recommendations, while low ratings (1-2 stars) alert teams to address product issues like battery life or build quality.
Enabled real-time competitive analysis by providing a user-friendly interface for cross-functional marketing and product development teams to audit customer sentiment at scale.