Projects using Looker Studio in DhakaProjects using Looker Studio in DhakaMarketing Reporting Dashboard, From Data Chaos to Real-Time Performance Clarity
Project Description:
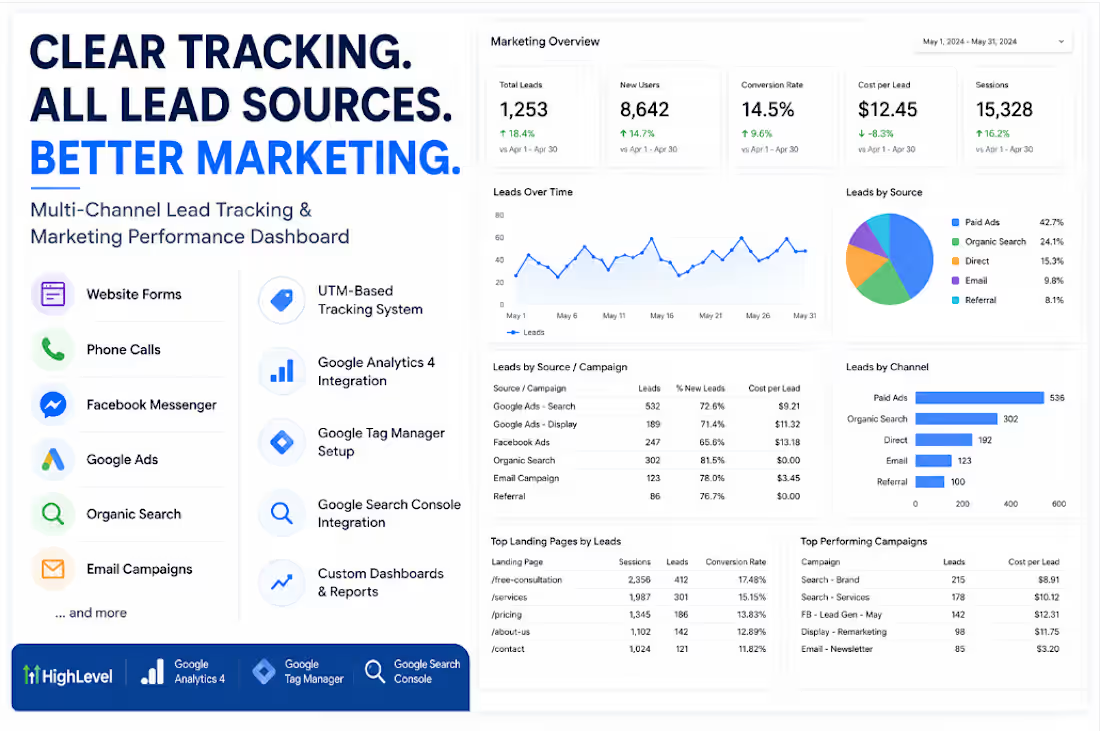
I built a fully automated marketing reporting dashboard for a client who had no clear view of how their campaigns were actually performing. Instead of digging through spreadsheets and ad platforms every week, they now have a single live dashboard that shows every key metric, updated automatically, in real time, across all channels.
<<<<<Full Project Write-Up>>>>>
The Problem
The client was running marketing campaigns across multiple channels, paid ads, email, social media, SEO, but had zero visibility into what was actually working.
Every week, someone had to manually pull data from Google Ads, Meta, email platforms, and analytics tools, paste it into a spreadsheet, format it, and then try to make sense of it. By the time the report was ready, the data was already outdated. Decisions were being made on guesswork, not facts.
They were spending budget without knowing which campaigns were driving revenue and which were burning cash.
The Solution
I designed and built a fully automated marketing reporting dashboard that pulls data from all their channels in real time and displays everything in one clean, decision-ready view.
Here is exactly what I built:
Step 1: Data Source Integration
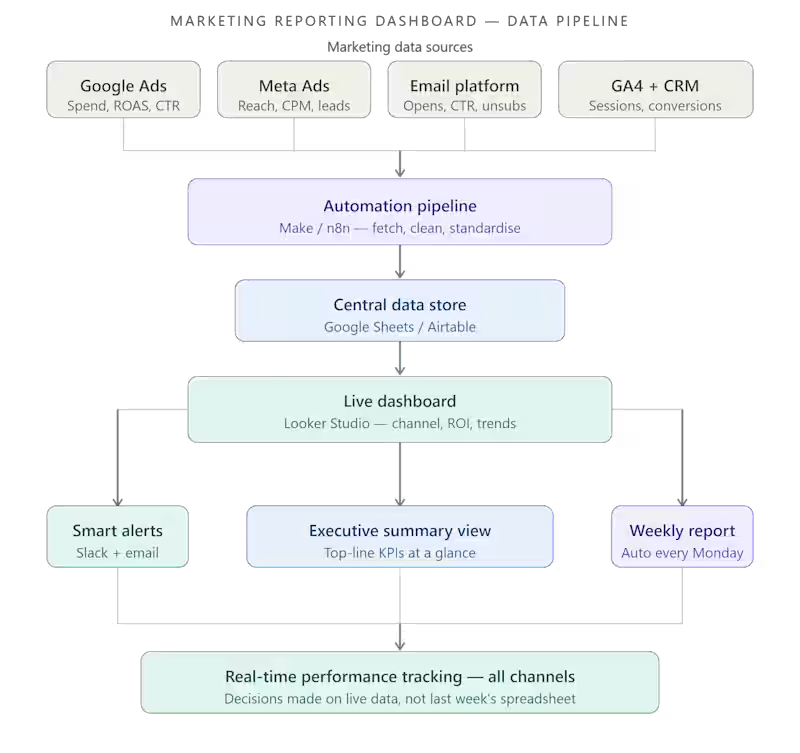
Connected all marketing platforms to a central data pipeline:
Google Analytics 4, website traffic, sessions, conversions
Google Ads, spend, clicks, CTR, ROAS, cost per lead
Meta Ads (Facebook + Instagram), reach, impressions, CPM, conversions
Email platform (Mailchimp / ActiveCampaign), open rates, CTR, unsubscribes
CRM, lead volume, deal value, attribution
Step 2: Automated Data Pipeline
Built an automation layer using Make / n8n that:
Pulls fresh data from every platform on a set schedule (hourly or daily)
Cleans and standardises the data into one consistent format
Pushes it to a central data store (Google Sheets or Airtable)
Triggers alerts if any metric drops below a defined threshold
Step 3: Live Dashboard Build
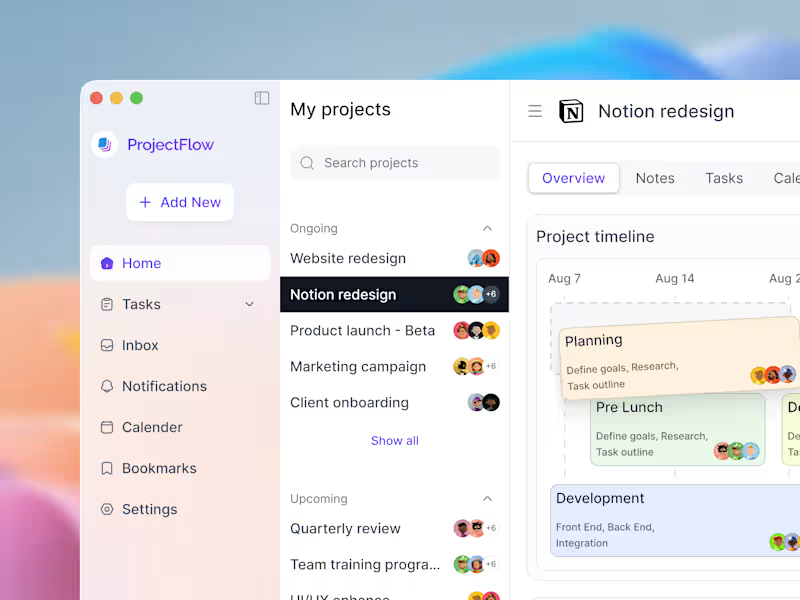
Built the reporting dashboard in Looker Studio (or Notion / Airtable) with:
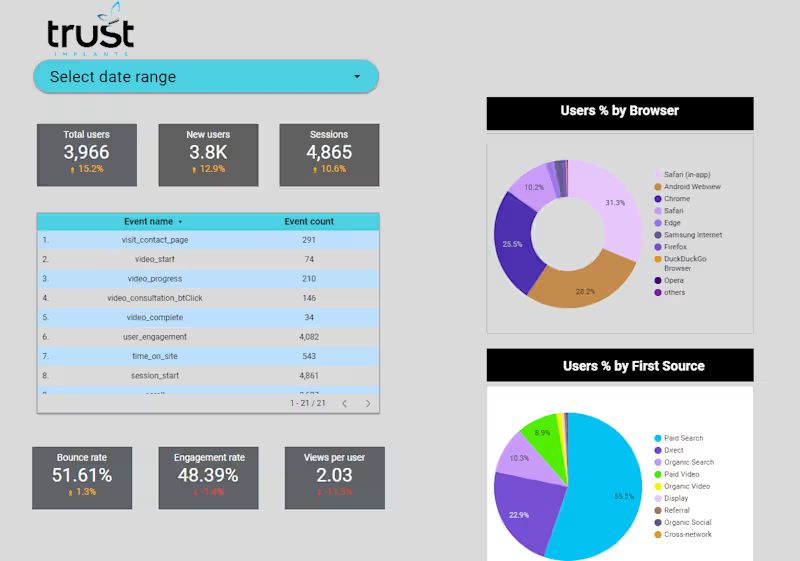
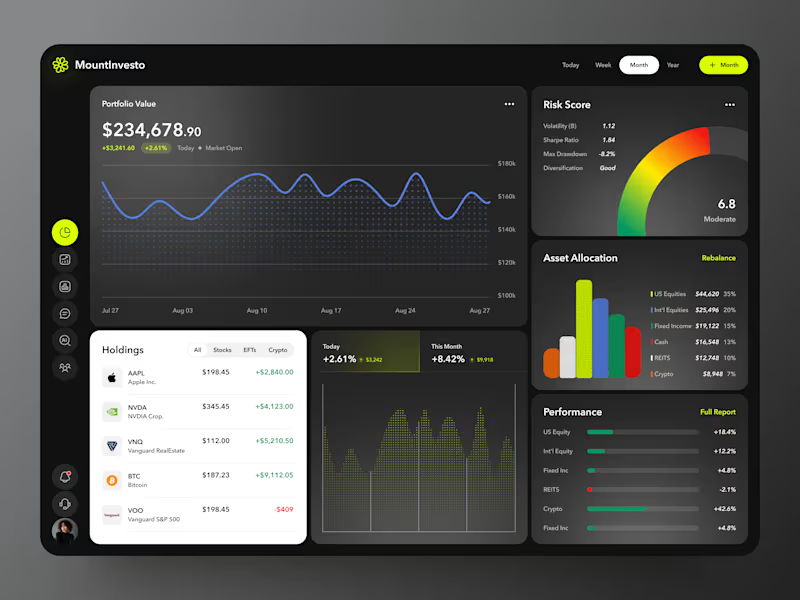
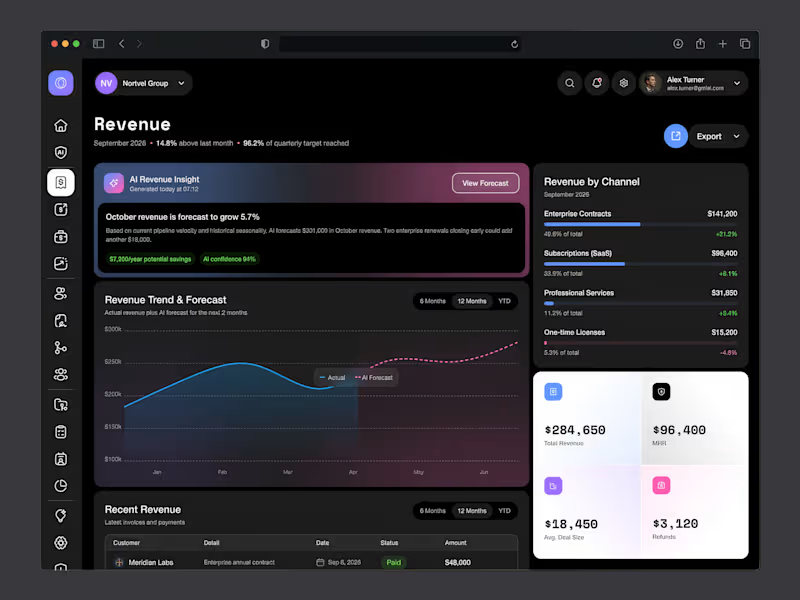
Executive summary view, top-line numbers at a glance
Channel-by-channel performance breakdown
Campaign ROI comparison across all platforms
Weekly and monthly trend charts
Cost per lead and cost per acquisition by source
Conversion funnel from click to closed deal
Step 4: Automated Alerts
Set up automated Slack and email alerts that notify the team when:
Ad spend exceeds daily budget threshold
ROAS drops below target
Email open rate falls significantly
A campaign goes from top performer to underperformer
Step 5: Automated Weekly Report
Every Monday morning, a formatted performance summary is automatically sent to the marketing manager, no manual pulling, no formatting, no delays.
The Result
Real-time marketing performance tracking across every channel, fully automated.
The client went from spending hours each week building reports manually to having a live dashboard that updates itself. They can now see at a glance which campaigns are driving results, where budget is being wasted, and exactly where to focus next week's effort, all before their morning coffee.
Tools & Tech Stack
Looker Studio / Google Data Studio: dashboard and visualisation
Google Analytics 4: web traffic and conversion tracking
Google Ads API: paid search performance
Meta Ads Manager: paid social performance
Make / n8n / Zapier: data pipeline automation
Google Sheets / Airtable: central data store
Slack + Email — automated alerts and weekly reports
Mailchimp / ActiveCampaign: email marketing data
Key Outcomes
✅ Single dashboard replacing 5+ manual reports
✅ Data refreshes automatically, always up to date
✅ Full channel visibility: paid, organic, email, social
✅ Automated weekly summary reports, zero manual prep
✅ Real-time alerts when performance dips
✅ Faster, data-driven decisions every single week
Who This Is For
This dashboard is built for you if:
You are running marketing across multiple channels but have no unified view
Your team spends hours every week building the same report manually
You make budget decisions based on gut feel rather than real data
You want to know which campaigns are actually driving revenue — not just clicks
You are scaling marketing spend and need clarity before you increase budget
Why Work With Me
Most marketing dashboards show vanity metrics that look impressive but do not help anyone make a decision. I build dashboards around the numbers that actually matter to your business, cost per lead, ROAS, conversion rate by source, and revenue attribution. Every widget earns its place. If it does not drive a decision, it does not go on the dashboard.
Ready to see all your marketing data in one place?
Send me a message on Contra. Tell me which platforms you are currently running campaigns on, I will tell you exactly how I would connect everything and what your dashboard would look like within a week. Data is only valuable if it tells a clear story. 📉
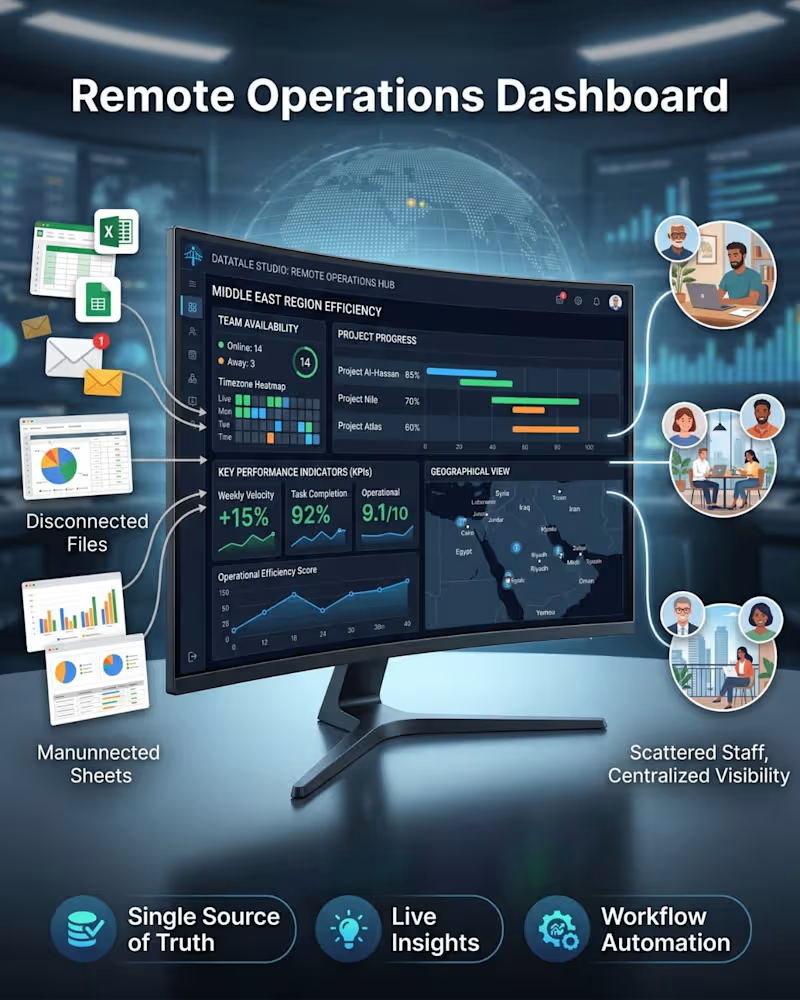
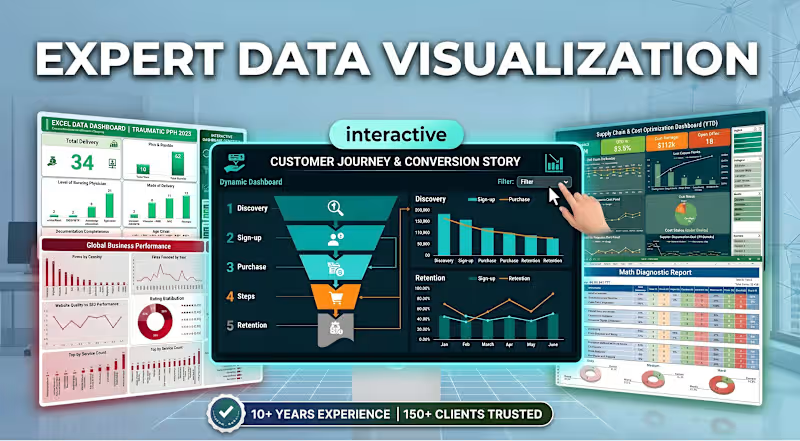
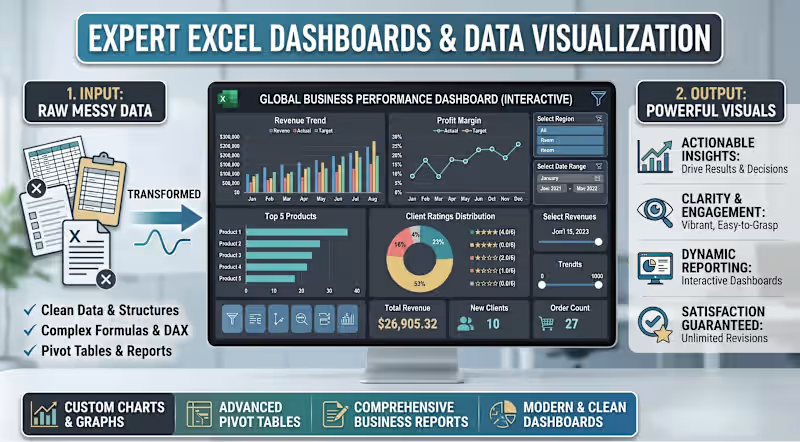
If you are tired of digging through static, confusing spreadsheets to find your KPIs, it's time for an upgrade. Welcome to DataTale Studio. I specialize in Expert Data Visualization, engineering interactive dashboards that turn complex, messy data into actionable insights.
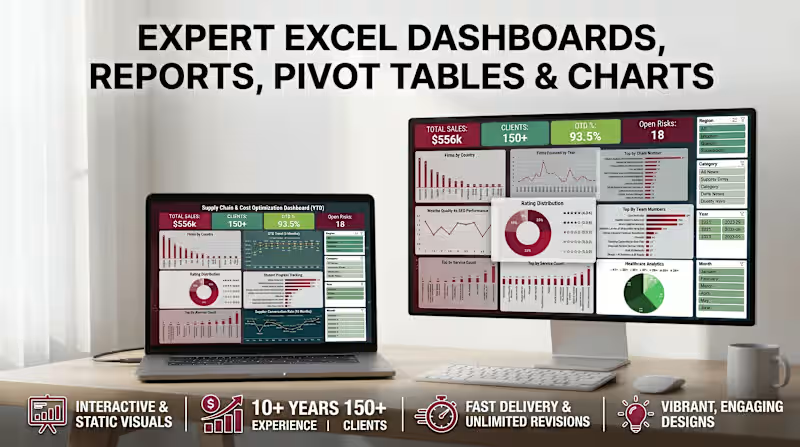
Whether you need to map a Customer Journey funnel, track Global Business Performance, or optimize your Supply Chain, I build the exact visual systems you need to make fast, data-driven decisions.
What you get when we collaborate:
✔️ Interactive Dashboards: Filter, sort, and engage directly with your metrics in real-time.
✔️ Executive-Level Clarity: Clean, elegant designs that highlight the numbers that actually matter to your business.
✔️ Proven Expertise: Backed by 10+ years of data analytics experience and trusted by 150+ clients globally.
Stop guessing and start analyzing. If you are ready to transform your corporate reporting, check out my services and send an inquiry to start building your custom interactive dashboard today! 📊 How to Turn Raw, Messy Data Into Powerful Business Insights 📊
If you are spending hours wrestling with complex spreadsheets, it’s time for a system upgrade. How do you bridge the gap between heavy data entry and strategic decision-making? By moving from static files to interactive, automated reporting.
At DataTale Studio, I specialize in transforming fragmented data into dynamic Excel dashboards that drive real business results.
The Transformation Process:
The Input: I take your raw data and build a robust backend using clean structures, complex formulas, and advanced DAX.
The Output: You receive a modern, clean dashboard featuring custom charts, advanced pivot tables, and vibrant data visualization.
Why collaborate with DataTale Studio?
Actionable Insights: Replace confusing rows of numbers with clear, visual metrics.
Dynamic Reporting: Interact directly with your data to spot trends instantly.
Satisfaction Guaranteed: I offer unlimited revisions to ensure your custom dashboard perfectly fits your workflow.
Stop guessing and start analyzing. If you are ready to streamline your business reporting, let's get to work. Send an inquiry today to discuss your custom data visualization project! ⚙️