Freelancers using Dash Plotly in Dhaka
Freelancers using Dash Plotly in Dhaka
Sign Up
Post a job
Sign Up
Log In
Filters
2
Projects
People
Istiak Ahmed Khan
Dhaka, Bangladesh
Power BI Data Analyst + ML AI Automation Expert
5.0
Rating
100
Followers
Follow
Message
Power BI Data Analyst + ML AI Automation Expert
3
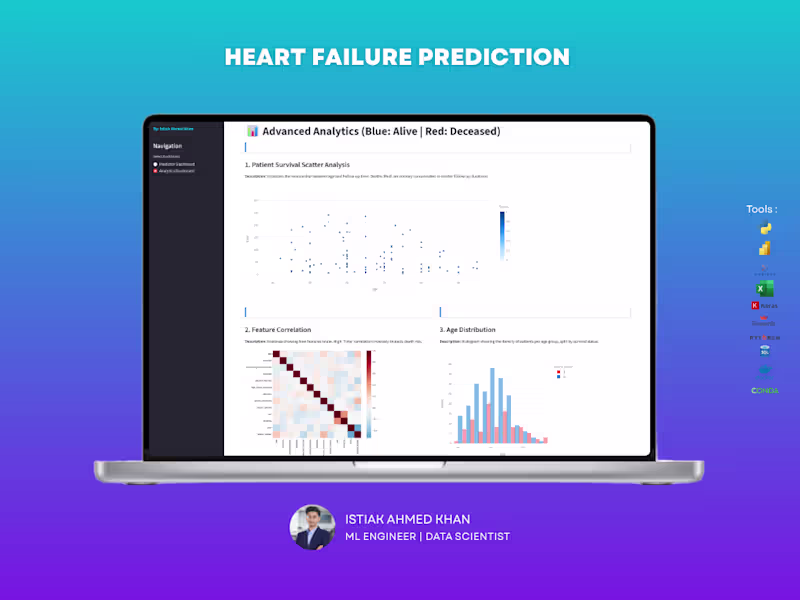
Saving Lives through Early Clinical Risk Detection Application is live at: https://495a-35-237-151-197.ngrok-free.app The Problem: Heart failure is a leading cause of global mortality; the difference between survival and fatality often depends on how early a high-risk patient is identified. The Solution: I developed a clinical diagnostic tool that analyzes patient health markers to forecast mortality risk, assisting medical professionals in prioritizing life-saving care. Key Impacts: Early Intervention: The model identified that follow-up time is the single most critical factor in reducing fatalities, emphasizing the need for early diagnosis and consistent monitoring. Precision Diagnostics: By analyzing heart efficiency (ejection fraction) and chemical markers like serum creatinine, the tool provides a high-accuracy (84.49%) risk score for every patient. Clinical Support: The system helps doctors look past "statistical flukes" by accounting for outliers in medical data, ensuring that extreme clinical cases are caught rather than ignored. Actionable Health Insights: Demonstrated a clear link between age, heart efficiency, and chemical abundance, giving providers a data-driven framework to improve long-term patient outcomes
1
3
688
10
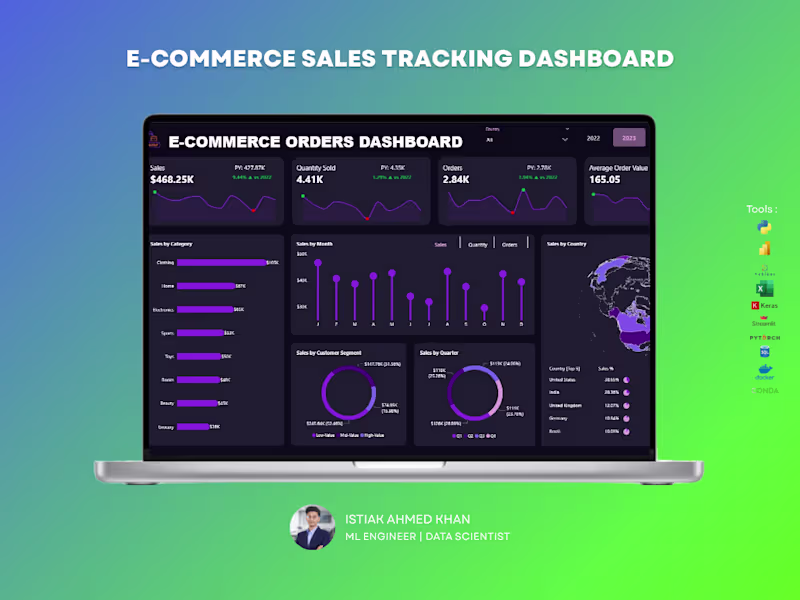
The E-Commerce Orders Dashboard provides a comprehensive overview of order performance, revenue trends, and customer purchasing behavior. Designed for online businesses, this dashboard transforms transactional order data into actionable insights that support growth, operational efficiency, and strategic decision-making.
2
10
1.3K
18
Email Marketing Analytics Dashboard – UI/UX Design Struggling to track campaign performance across multiple channels? This dashboard is designed to give you a complete, real-time view of your marketing efforts in one clean and intuitive interface. A powerful, easy-to-use dashboard that helps you monitor email, SMS, social media, and push campaigns without the confusion of scattered data. Every key metric is presented clearly so you can make faster, smarter decisions. Key Capabilities: Track open rates, click rates, conversions, and revenue in real time, Compare performance across multiple marketing channels, Identify your top-performing campaigns instantly, Understand audience engagement with clear visual breakdowns, Spot trends and optimize campaigns quickly. Most businesses run campaigns but struggle to understand what’s actually working. This dashboard eliminates guesswork by turning your data into clear, actionable insights — helping you improve ROI and scale winning strategies. Perfect For: Digital marketers, E-commerce brands, Agencies managing multiple campaigns, Startups looking to optimize growth. If you want a high-converting, professional dashboard that not only looks great but drives real business decisions — I can help you build it.
8
18
912
6
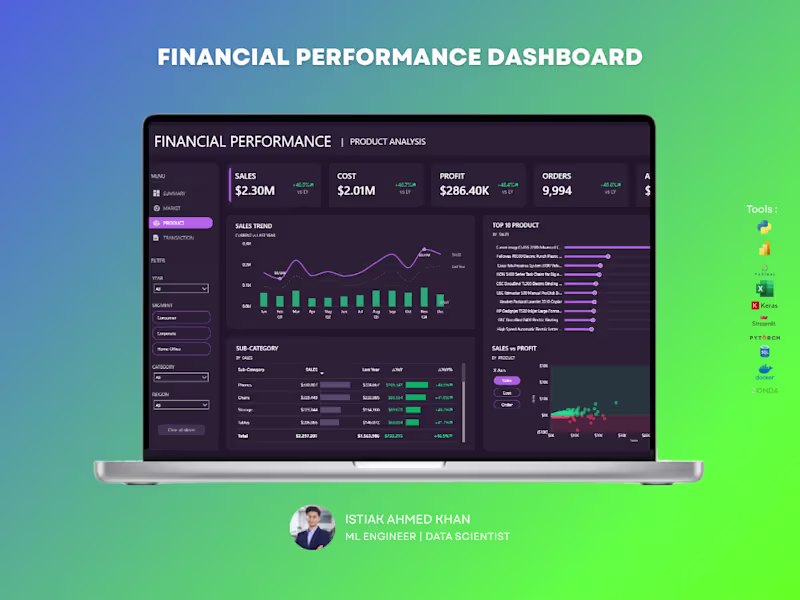
The Financial Performance Dashboard provides a comprehensive overview of an organization’s financial health by tracking revenue, expenses, profitability, and key financial indicators. Built using Power BI, this dashboard enables finance teams and decision-makers to monitor performance, identify trends, and make data-driven strategic decisions.
6
958
Dash Plotly
(1)
Follow
Message
Explore people