
NanoMech: The Real-Time Multimodal AI Trading Assistant 📈🤖
Built for the Gemini Hackathon
Traders know that in the market, seconds equal dollars. By the time you switch between your chart, your analysis tools, and your risk calculator, the candle has already moved, and your setup is gone.
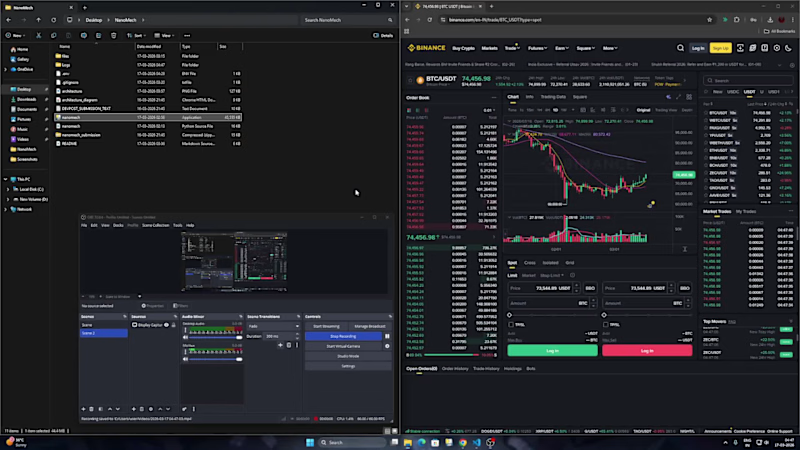
I wanted to fix this. For the Gemini Hackathon, I built NanoMech—an AI that sits on top of your screen, sees exactly what you see, and gives you a complete trade plan in seconds. No API keys required, and no leaving your chart.
💡 The Solution
NanoMech runs as two frameless, transparent overlays on top of any trading platform. It uses Google Gemini 2.5 Flash's multimodal vision capabilities to visually read your screen and deliver instant insights.
Overlay 1: Market Analysis
Trend: Analyzes bullish/bearish market structure and moving average crossovers.
Liquidity: Evaluates order book depth, bid/ask walls, and support/resistance zones.
Momentum: Breaks down candlestick patterns, volume behavior, and price velocity.
Overlay 2: Trade Setup & Risk Management
AI-Extracted Targets: Instantly provides Entry Price, Target Price, and Stop Loss.
Live CALC Engine: Calculates Risk Amount ($), Position Size (Units), and Risk-to-Reward (R:R) Ratio. Everything updates live as you type in your desired risk percentage.
🛠️ How It Works (Under the Hood)
Vision-to-Text Processing: Captures the screen in real-time using the mss library and sends the raw screenshot to Google Gemini 2.5 Flash via the Google GenAI SDK.
Prompt Engineering: Engineered strict structured prompts using [ANALYSIS] and [TRADE] tags to force the LLM to output reliably parseable price data.
Regex Extraction: Uses regex to pull the exact Entry, Target, and Stop prices from the AI's response and wire them directly into the local risk calculator.
Custom Desktop UI: Built always-on-top transparent overlays using Python's Tkinter, utilizing threading to keep the UI fully responsive during API calls.
Hands-Free Scanning: Integrated a global hotkey (Ctrl+A+I) and an Auto Mode that scans the chart every 20 seconds.
🧗♂️ Challenges Overcome
Structured LLM Outputs: Getting an LLM to consistently return prices in a parseable numeric format is notoriously tricky. We solved this with rigorous prompt engineering and robust fallback handling.
Thread-Safe UI: Tkinter isn’t thread-safe. We engineered a solution to route all UI updates through root.after() callbacks from the active analysis thread.
UX/UI Friction: Tuning the transparency and colors so the text remains readable across both dark and light chart themes, while ensuring our global hotkeys didn't conflict with native trading platforms.
🚀 What We Learned & What's Next
This project proved just how incredibly capable Gemini 2.5 Flash is at visual reasoning. It accurately identified complex candlestick patterns, moving averages, and volume spikes from a raw image alone.
The Roadmap for NanoMech:
Voice Output: Speaking the trade setup aloud for a 100% hands-free experience.
Multi-Monitor Support: Allowing users to select which screen the AI tracks.
Cloud Hosting: Running NanoMech as a scalable web service on Google Cloud Run.
Trade Logging: Automatically tracking how the AI's setups perform over time.
💻 Built With
Python | Google Gemini 2.5 Flash | Google GenAI SDK | Google Cloud | Tkinter | mss | pillow | Regex
Ready to try it out? Check out the code and run it yourself: https://github.com/omshukla24/NanoMech
0
254

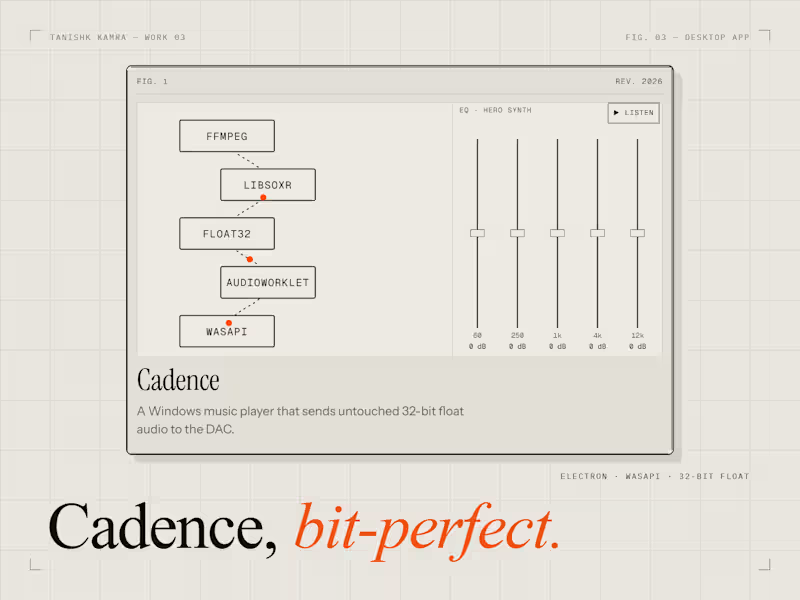
A Windows music player for people who care how their music sounds. It sends untouched 32-bit float audio to the DAC through WASAPI exclusive mode. The interface keeps a big library calm: smart lists, a tag editor, synced lyrics, and a 5 to 31-band equalizer with 8,850 headphone profiles. Gapless playback and crossfade.
0
107
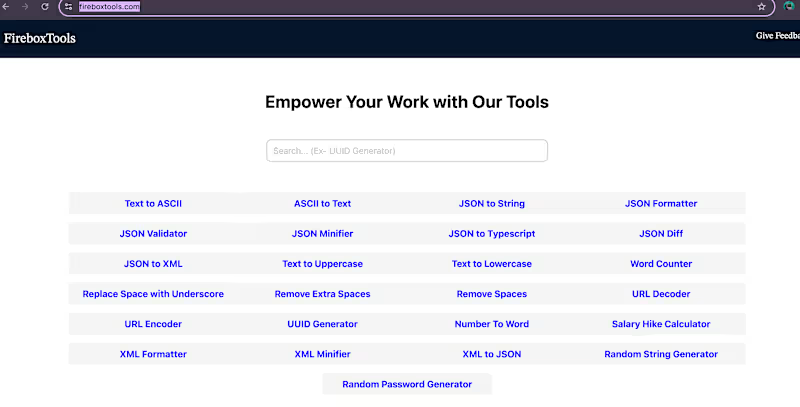
Shipped a live suite of developer utility tools — JSON formatter, validator, minifier, and diff checker; XML formatter/minifier/converter; encoding/decoding tools; UUID generation; and text-processing utilities.
Owned the project end-to-end: logic, parsing and conversion algorithms, and deployment, with all processing handled client-side rather than relying on server calls — a deliberate choice for data privacy and speed.
0
54
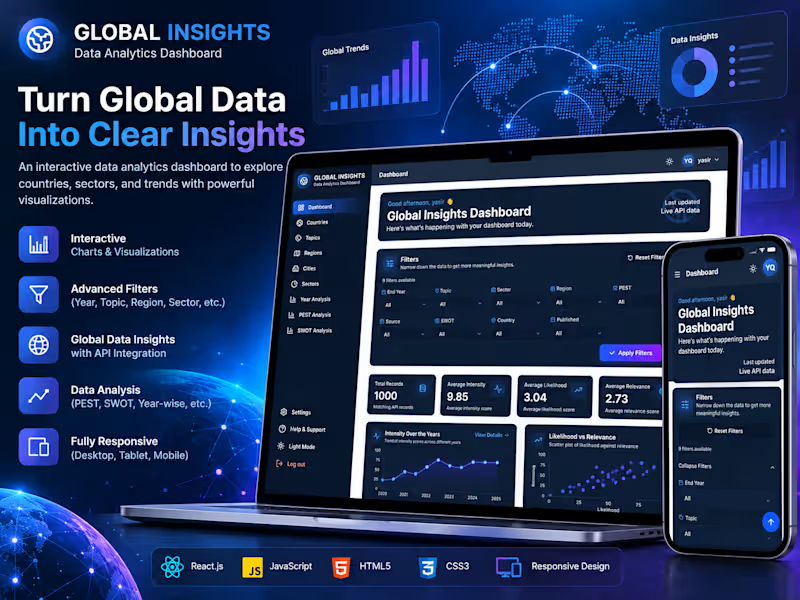
Global Insights — Data Analytics Dashboard
Global Insights is a modern, responsive data analytics dashboard built to transform complex datasets into a clear and interactive experience. The project focuses on helping users explore global data through structured filters, key performance indicators, and visual analytics.
I designed and developed the frontend with a strong focus on clean UI, usability, responsive layouts, and data-driven components. The dashboard includes a central overview with KPI cards, advanced filtering, interactive charts, and multiple analysis sections for exploring different dimensions of the data.
Key Features
Interactive Dashboard — Centralized view of important data and insights.
Advanced Filters — Filter data by End Year, Topic, Sector, Region, PEST, Source, SWOT, Country, and Published date.
KPI Cards — Display key metrics such as total records, average intensity, likelihood, and relevance.
Interactive Data Visualization — Charts for analyzing trends, comparisons, and relationships within the dataset.
Year Analysis — Explore how data and trends change over different years.
PEST Analysis — Analyze Political, Economic, Social, and Technological factors.
SWOT Analysis — Explore strengths, weaknesses, opportunities, and threats within the data.
Country & Regional Insights — Explore data across different countries, regions, cities, and sectors.
REST API Integration — Fetch and display dynamic data from an external API.
Dark & Light Mode — Theme switching for a more personalized experience.
Responsive Design — Optimized for desktop, tablet, and mobile screens.
Reusable Components — Structured the interface into reusable React components for easier maintenance and scalability. Technologies Used React.js • JavaScript • Tailwind CSS • Recharts • REST APIs • HTML5 • CSS3 • Responsive Web Design.
Project Goal The main goal was to build a practical analytics platform that combines data, visualization, filtering, and user-friendly design into one cohesive interface while strengthening my skills in React development, data visualization, API integration, and responsive UI/UX.
0
26
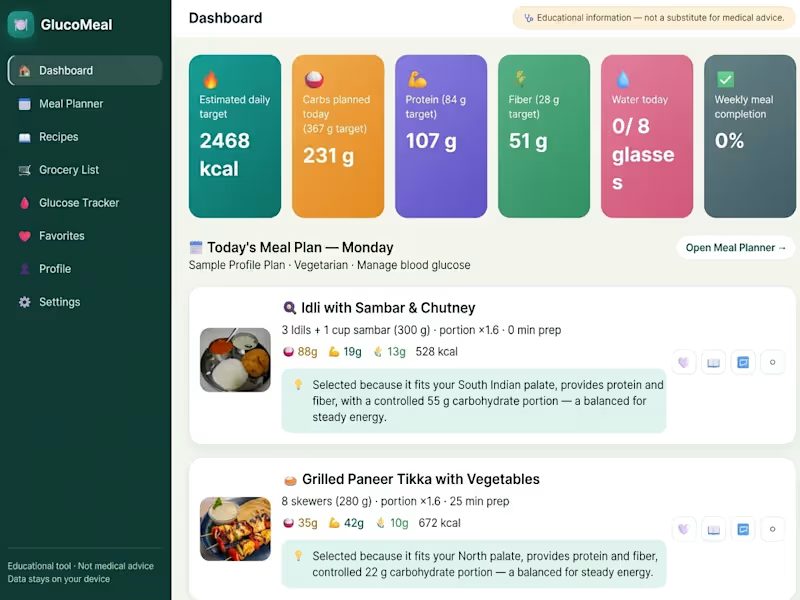
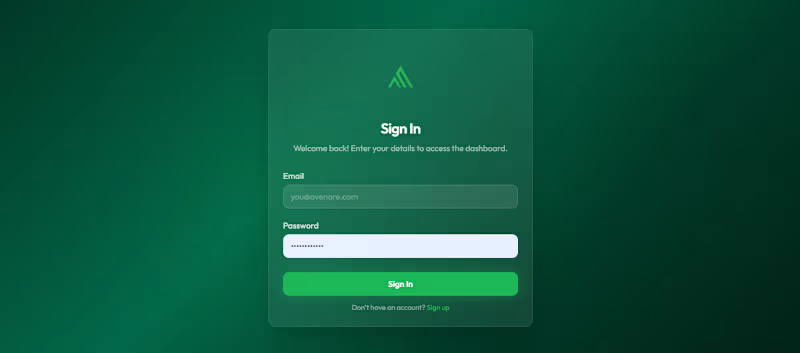
I worked on the backend and full-stack development of Avenore CRM, building business workflows and integrations that support operational management. The system includes user management, booking management, service management, payment links, UPI QR generation, proforma/tax invoice generation, and payment tracking.
0
41