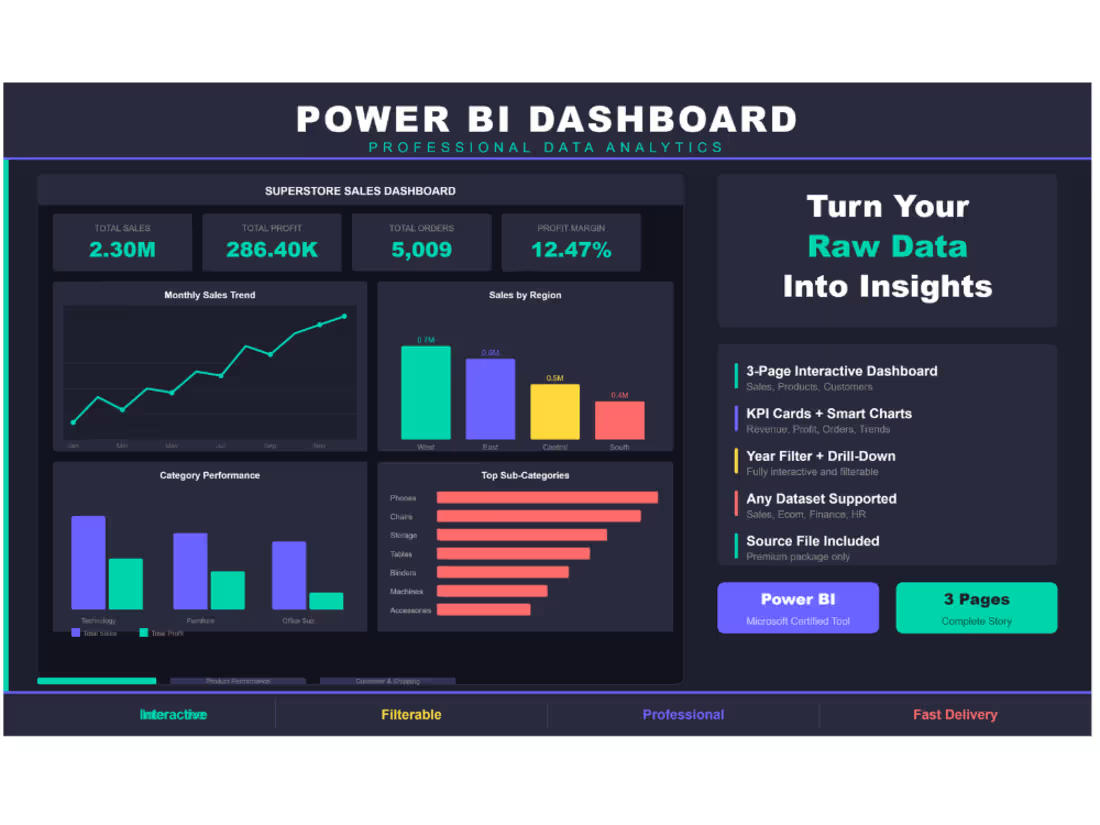
Projects using Microsoft Power BI in BhiwandiProjects using Microsoft Power BI in BhiwandiSuperstore Sales Dashboard — 3-Page Power BI Report
Built an interactive 3-page Power BI dashboard using
the Superstore Sales dataset (9,994 orders across USA).
Page 1 — Sales Overview: KPI cards, monthly trend,
regional breakdown, category performance.
Page 2 — Product Performance: Top products, category
donut, profit analysis, sales vs profit scatter.
Page 3 — Customer & Shipping: Segment breakdown,
top 10 customers, monthly growth, ship mode distribution.
Tools: Power BI, DAX, Superstore Dataset
Theme: Dark professional with interactive year filter. Data Analyst & Power Platform Specialist
📍 Mumbai, India | 📞 +91 7021027927 | ✉️ maheshkheder329@gmail.com (mailto:maheshkheder199@gmail.com)
Analytical and results-driven Data & MIS Specialist with 5+ years of experience optimizing reporting frameworks, automating complex workflows, and designing business intelligence solutions in the financial and insurance sectors. Skilled in transforming raw data into actionable insights using Power BI, SQL, Advanced Excel (VBA), and Power Automate. Recognized for delivering end-to-end data pipelines, custom approval workflows, and robust financial models.
Core Capabilities & Technical Toolkit
Business Intelligence & Dashboards: Power BI (Expert DAX, Power Query, Dynamic RLS), SAP BO, Trend & P&L Analysis
Database & Data Architecture: SQL (Data Modeling, Query Optimization, Joins, Data Validation), Dataverse, SharePoint Lists
Process Automation: Excel VBA Macros, Power Automate (Multi-stage Approval Workflows, Data Integration)
Analytics : Data Cleaning, Data Reconciliation, Python (Data Processing & Visualization) 🏦 Bank Loan Portfolio Analysis | Power BI Dashboard Project
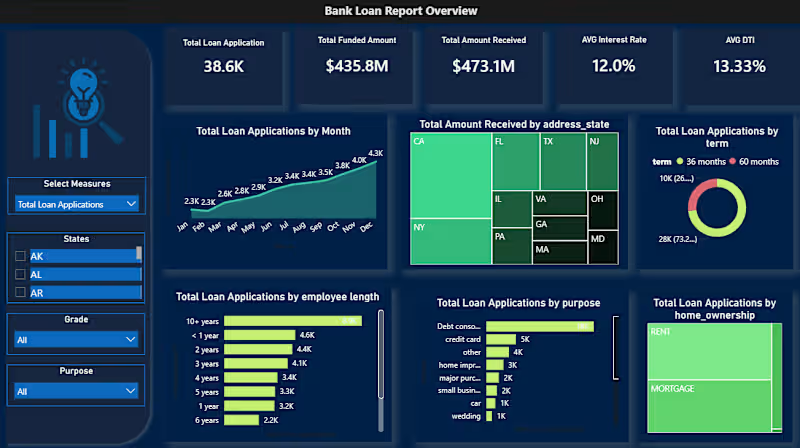
Analyzed 38,576 loan records across 50 states to give a bank's lending division a unified view of portfolio health — something they simply didn't have before.
What the data revealed:
✅ Net-positive portfolio: $435.8M disbursed, $473.1M recovered
⚠️ 13.8% bad loan rate = $28.25M net capital loss
📊 Debt consolidation drives nearly half of all loan applications
⏳ 73% of borrowers chose 60-month terms over 36-month
📍 60%+ of repayments concentrated in just 5 states (CA, NY, FL, TX, NJ)
Tools used: PostgreSQL → Excel → Power Query → Power BI + DAX
Built two interactive dashboards:
→ Summary: KPI cards, good vs. bad loan segmentation, loan status grid
→ Overview: Trends, geographic maps, term/purpose/employment breakdowns
The next phase? Building a predictive risk scoring layer using DTI, interest rate, and employment length to flag at-risk loans before they default.
Open to feedback from data folks in the community 👇
#PowerBI #DataAnalytics #SQL #DAX #BankingAnalytics #PortfolioAnalysis #DataVisualization