I’m an AI & Machine Learning engineer with expertise in deve
I’m an AI & Machine Learning engineer with expertise in deve
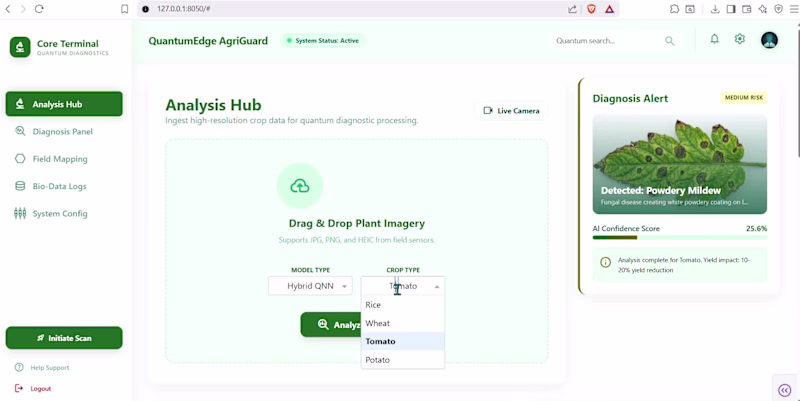
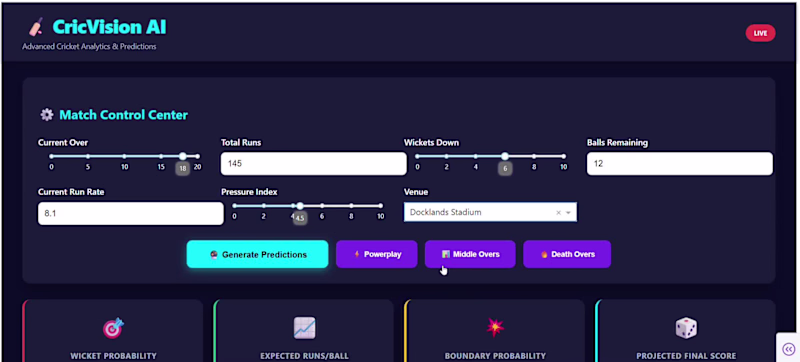
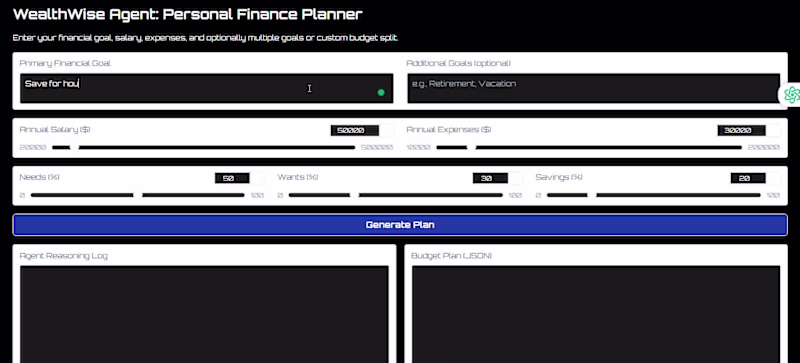
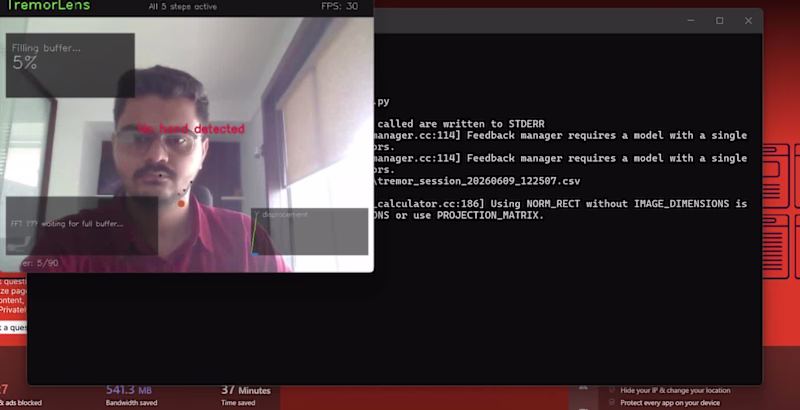
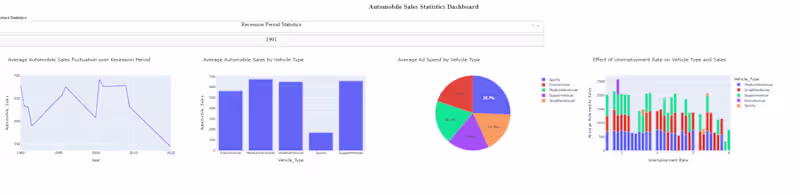
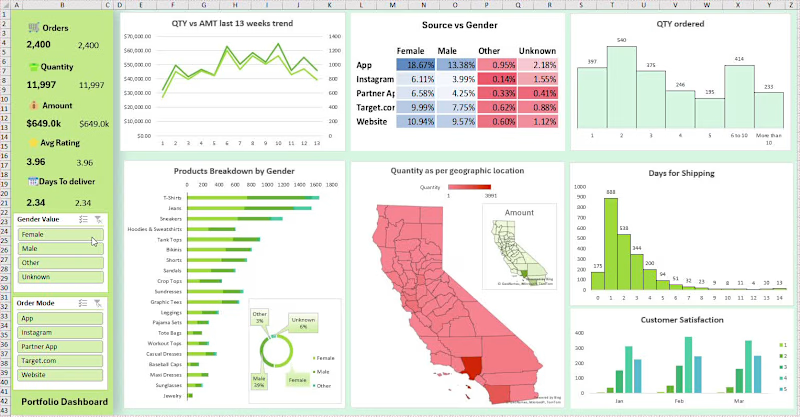
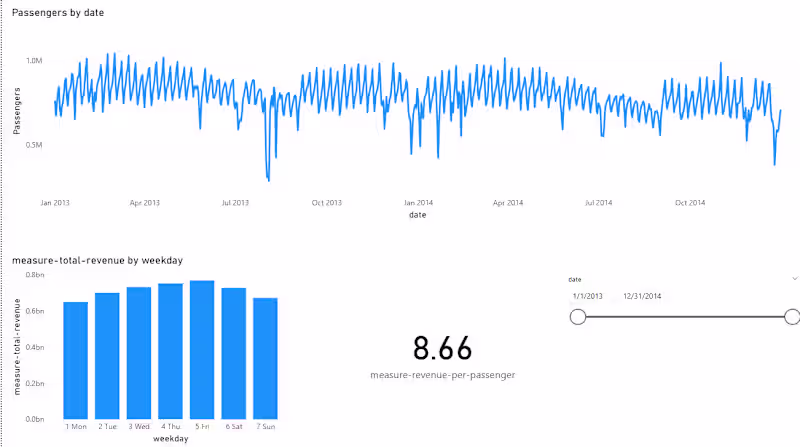
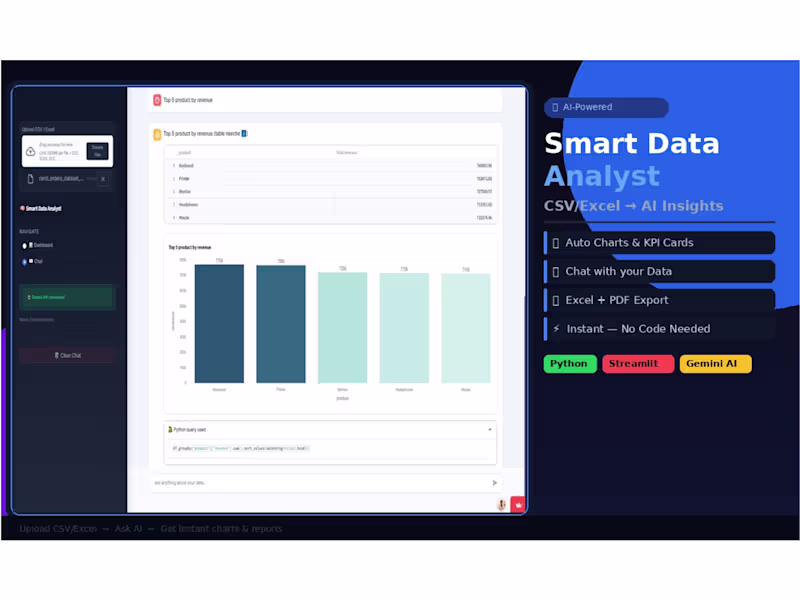
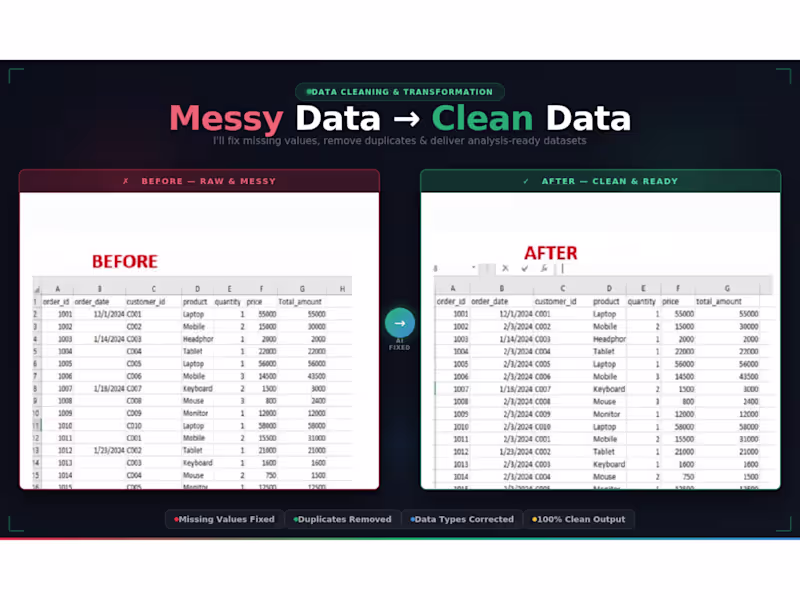
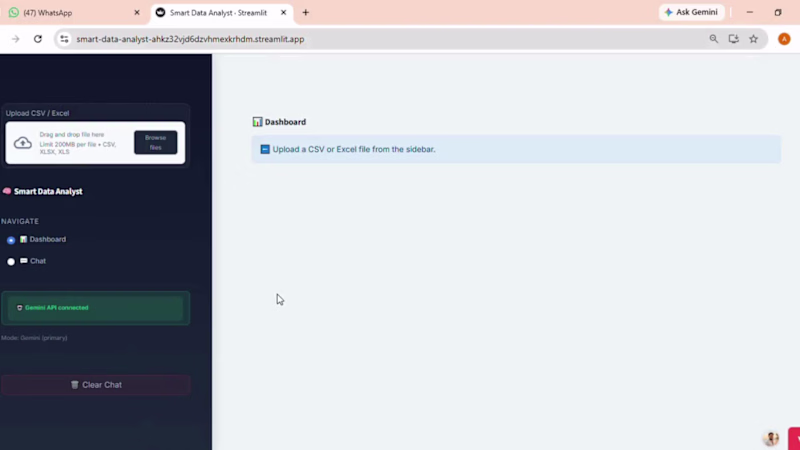
I build AI-powered data apps and dashboards

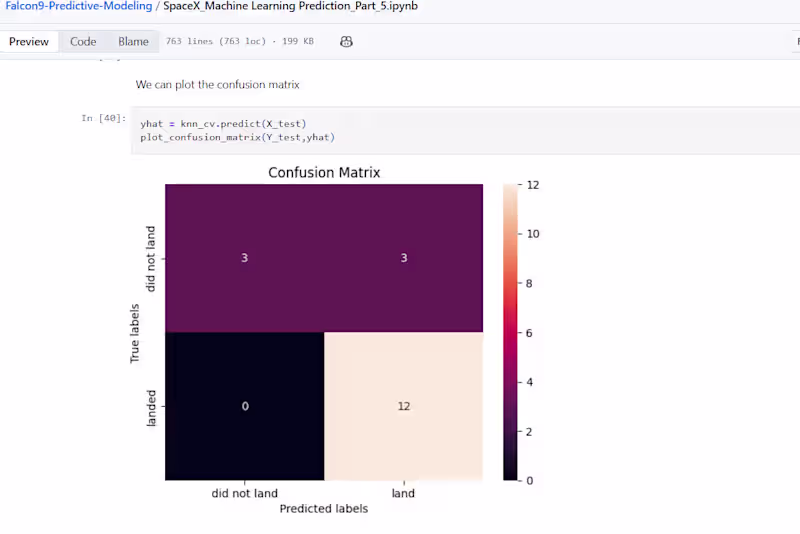
Data Science/Analysis, Excel, Python, Power Bi, Scikit learn
Data Science/Analysis, Excel, Python, Power Bi, Scikit learn