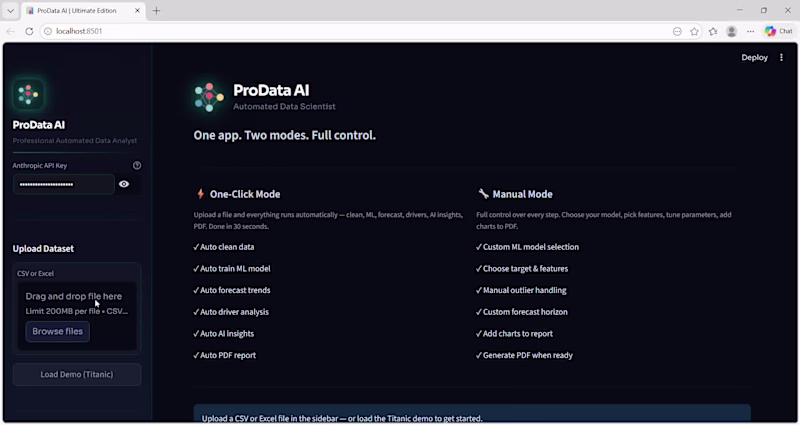
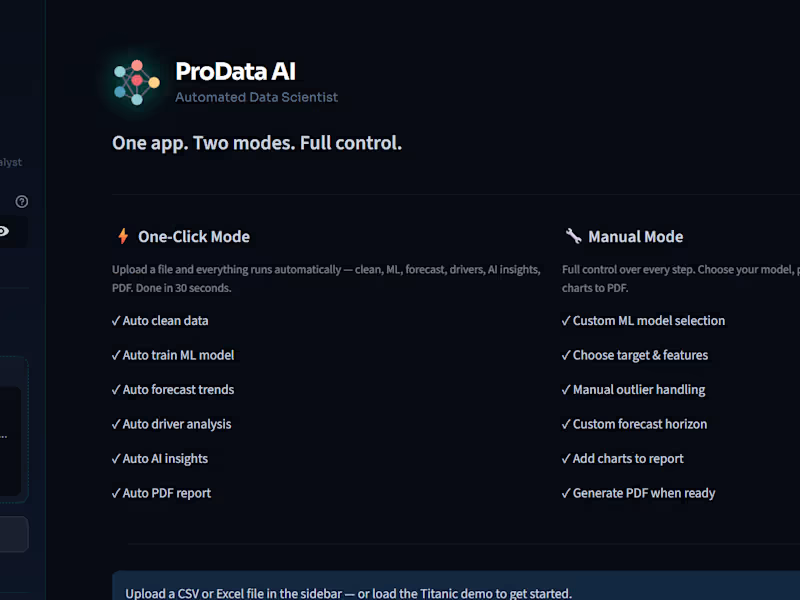
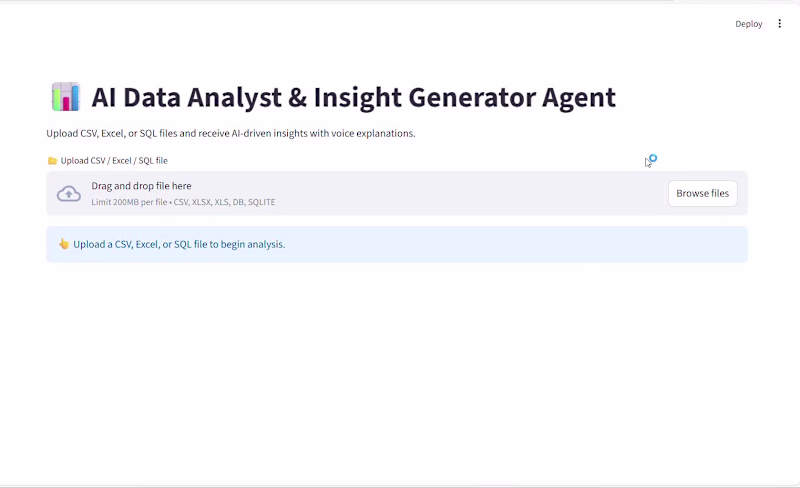
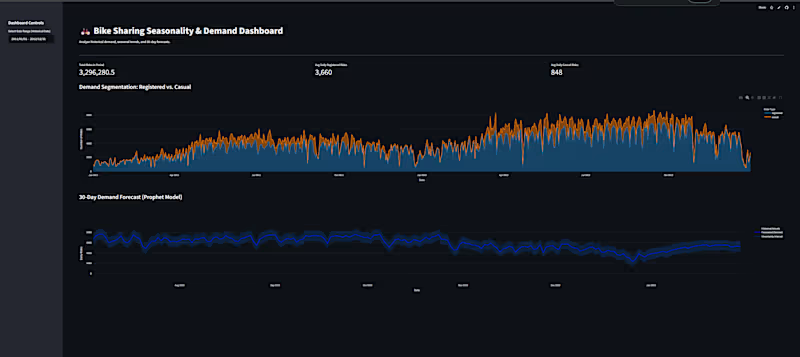
Freelancers using Streamlit in Bengaluru
Sign Up
Post a job
Sign Up
Log In
Filters
2
Projects
People
Varun Walekar
Bengaluru, India
Data Analyst | Power BI | Python | SQL | Excel | ML
New to Contra
Follow
Message
Data Analyst | Power BI | Python | SQL | Excel | ML
2
I built an AI-powered Data Analyst that turns raw CSV, Excel, or SQL data into executive-ready insights. ✅ Automatic EDA & outlier detection ✅ Visual charts & insights ✅ Executive PDF report ✅ Business recommendations ✅ Voice-based summaries This isn’t a dashboard — it’s an AI analyst for founders and teams who want fast decisions. 🎥 Watch the demo video 📩 Message me “AI Analyst” for access or a custom build #AI #DataAnalytics #Automation #BusinessIntelligence #Streamlit
1
2
119
1
Built an AI Data Analyst That Explains & Speaks Insights 🤖📊 I built an AI-powered Data Analyst that turns raw CSV, Excel, or SQL data into clear, understandable insights automatically — no manual analysis needed. ✔ Upload CSV / Excel / SQL ✔ Dataset overview & summary stats ✔ Auto charts & advanced EDA ✔ Correlation & outlier detection ✔ Data cleaning + downloadable dataset ✔ AI-generated explanations (dynamic per dataset) ✔ Voice explanation — AI speaks insights Designed for founders, businesses, analysts & non-technical users who want fast clarity from data. Currently building in public and preparing client-ready versions. 👉 Multiple service tiers available 👉 Early access & custom versions Drop a comment or DM me.
1
76
0
📊 Customer Churn Analysis Dashboard | Power BI Project Designed and developed an interactive Power BI dashboard to analyze customer churn for a banking dataset with over 9,900 customers. The primary objective was to identify key patterns and factors influencing customer attrition and deliver actionable insights to support effective retention strategies. 🔍 Key Features: Visualization of critical KPIs such as churn rate, account balance, and activity status Customer segmentation based on demographics and behavior Interactive filters for detailed comparison and analysis Clear insights into high-risk customer groups 📈 Impact: This project enhanced understanding of customer behavior and empowered stakeholders to make data-driven decisions to reduce churn and improve customer engagement. Tools Used: Power BI, DAX,Data Visualization
0
7
3
Online Retail Sales Analysis Dashboard I built this interactive Power BI dashboard to analyze online retail sales performance and customer behavior. Key insights covered: 📈 Monthly revenue trend and seasonality analysis 👥 Customer segmentation (Repeat vs One-time customers) 🌍 Country-wise sales volume and revenue comparison 💰 Business KPIs: Total Sales Revenue, Total Orders, Total Customers & Average Order Value 🏆 Identification of top revenue-generating customers Tools & Skills: Power BI | DAX | Data Modeling | Data Cleaning | Data Visualization This dashboard helps businesses quickly understand where revenue comes from, who their best customers are, and how sales perform over time. Open to freelance projects related to Power BI dashboards, sales analysis, and business intelligence reporting.
4
3
268
Streamlit
(2)
Follow
Message
Narayanan M
Bengaluru, India
Your data, My passion—Meets innovation for impactful results
Follow
Message
Your data, My passion—Meets innovation for impactful results
0
301 Moved Permanently
0
1
0
COVID-19 Data Analysis Using Python
0
0
0
Extracting and Visualizing Stock Data
0
2
View more →
Streamlit
(1)
Follow
Message
Yathiraja Ag
Bengaluru, India
backend developer building robust, scalable application
Follow
Message
backend developer building robust, scalable application
0
Sdjshi/Face-detection-and-recognition-for-crimminal-identificat…
0
0
0
Tourism Management System Development
0
1
0
LiveEdgeDetection: Android Document Detection Library
0
0
View more →
Streamlit
(1)
Follow
Message
Explore people