Freelancers using Dash Plotly in Bahawalpur
Freelancers using Dash Plotly in Bahawalpur
Sign Up
Post a job
Sign Up
Log In
Filters
2
Projects
People
Imaad Mahmood
Bahawalpur, Pakistan
Data Scientist | Data Analyst | Machine Learning
Follow
Message
Data Scientist | Data Analyst | Machine Learning
1
FinCast Pro Development
1
2
1
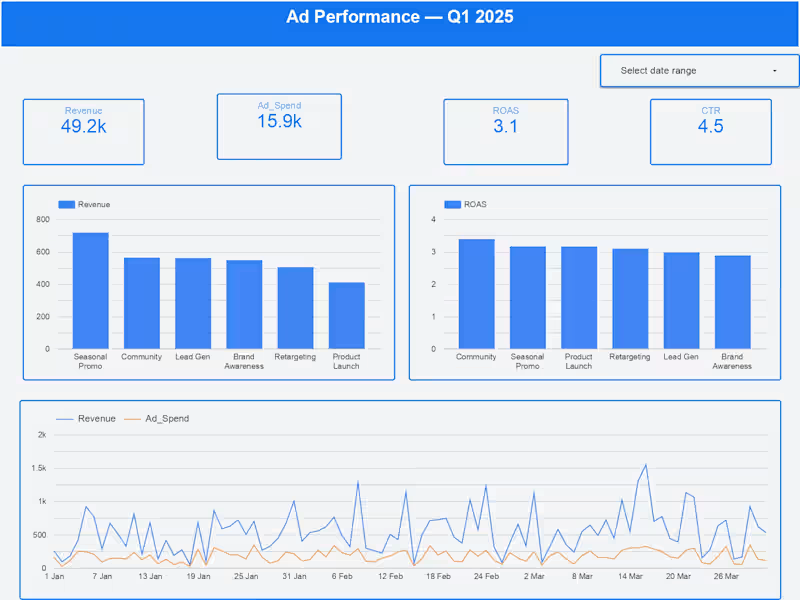
How do you turn $15.9K in ad spend into $49.2K in revenue? You stop guessing and start tracking Running paid social campaigns without granular visibility is essentially burning budget. For this Q1 2025 performance tracker, the goal wasn't just to make pretty charts—it was to build an automated, actionable intelligence tool that immediately identifies where marketing dollars are generating the highest return. The Data-Driven Insights: By analyzing over 2.7 million impressions and 1.8 million unique reach, this dashboard uncovered the exact levers driving profitability: 🚀 The ROI Engine: The overarching strategy yielded a highly profitable 3.1 Return on Ad Spend (ROAS). 🏆 Winning Formats: Carousel ads heavily dominated the space, capturing 21.9% of the share, proving that interactive, multi-image formats win the algorithm. 📅 Timing is Everything: Engagement rates spiked massively on Saturdays, reaching near 20%, indicating the optimal window for scaling ad spend. 🎯 Campaign Economics: While "Seasonal Promos" drove the highest total top-line revenue , the "Community" campaigns actually delivered the most efficient ROAS.
1
39
3
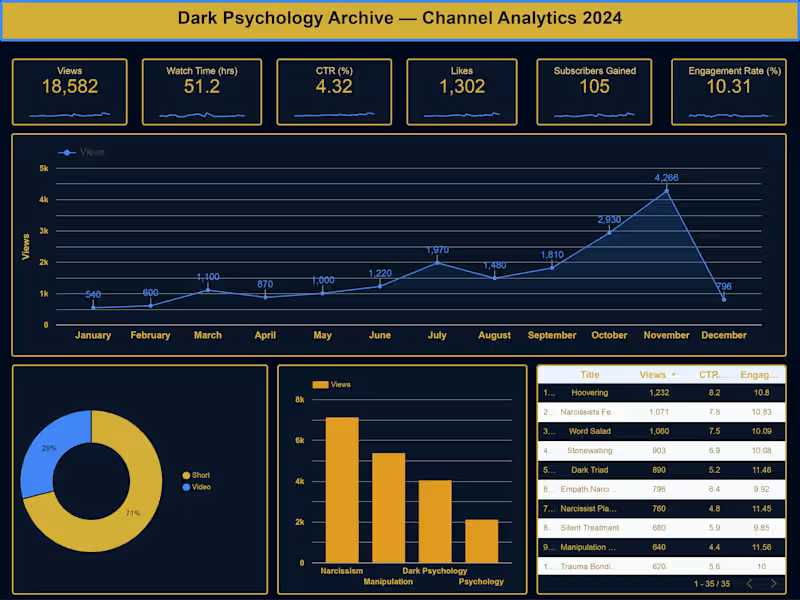
Built a full YouTube analytics dashboard in Google Looker Studio using real channel data from Dark Psychology Archive. The dashboard tracks 6 KPIs — Views (18,582), Watch Time (51.2 hrs), CTR (4.32%), Likes (1,302), Subscribers Gained (105), and Engagement Rate (10.31%). A monthly trend line reveals the growth curve peaking at 4,266 views in November. Content-type breakdown shows Shorts drive 71% of total views. Top performer: Hoovering at 1,232 views with 8.2% CTR. Built to help content creators make data-driven decisions on what to post, when, and in what format — without exporting CSVs manually.
3
134
1
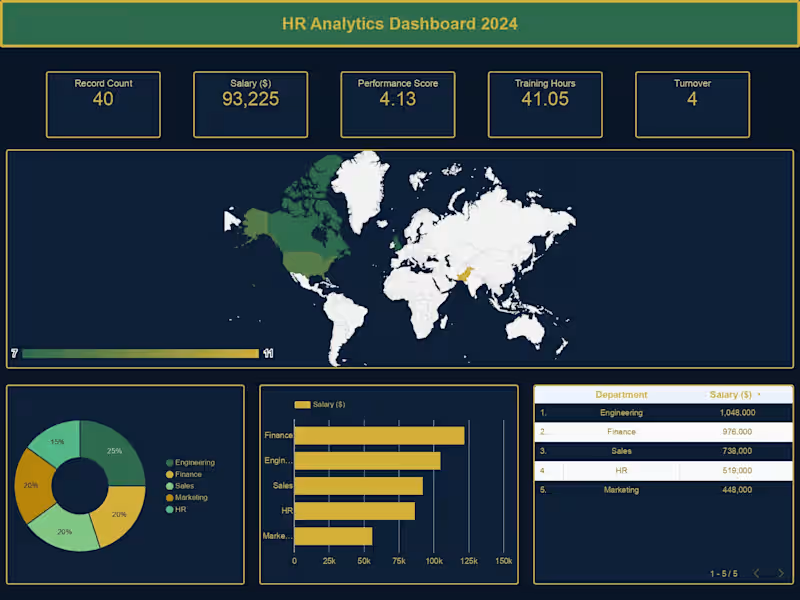
HR teams spend hours every week pulling salary, performance, and turnover data from separate spreadsheets. This dashboard puts all of it in one place — live. Built this HR Analytics Dashboard in Google Looker Studio with 5 KPI cards, department salary breakdown, geo distribution map, and a ranked leaderboard sorted by total compensation. Engineering leads at $1.05M total salary. Finance close behind. Decision-makers can see that in 3 seconds instead of 3 hours.
1
125
Dash Plotly
(1)
Follow
Message
Explore people