The network for creativity
Join 1.25M professional creatives like you
Connect with clients, get discovered, and run your business 100% commission-free
Creatives on Contra have earned over $150M and we are just getting started
Back to feedPost

Healthcare Facility & Operations | Power BI Dashboard
How efficiently are healthcare facilities operating, and what explains the differences in their performance?
This dashboard takes a close look at facility-level performance (For a hospital with several branches), exploring patient volumes, waiting times, consultation duration, and operational efficiency across healthcare facilities.
It moves beyond overall healthcare statistics to examine how individual facilities compare, where bottlenecks may exist, and how operational performance changes over time.
Some of the key analyses include:
Average Waiting Time by Facility, Encounter Volume by Facility, Facility Rankings Over Time, Waiting Time vs. Consultation Duration, Facility Performance Comparison, Monthly Operational Trends and more.
Interactive date filters and facility-level analysis make it easier to investigate specific periods, compare facilities, and identify patterns that may otherwise be hidden in summary reports.
The business intelligence perspective: Facility performance is not just about how many patients are served. It is also about how efficiently services are delivered, how resources are utilised, and where improvements may be needed.
Built with Power BI, this dashboard demonstrates how healthcare data can support operational monitoring, facility benchmarking, and more informed management decisions.


The network for creativity
Join 1.25M professional creatives like you
Connect with clients, get discovered, and run your business 100% commission-free
Creatives on Contra have earned over $150M and we are just getting started
Related posts


Mobile dashboard sheet interaction for sales automation platform

Esports players generate a lot of performance data. The challenge is making it useful at a glance.
Fragstat is a mobile analytics app concept that brings champion insights, match statistics, seasonal progress, and achievements into one clear experience. Soft blue gradients, translucent cards, bold typography, and character imagery give the data a distinct gaming identity.
The result is a more approachable way to review performance, spot patterns, and follow progress over time.


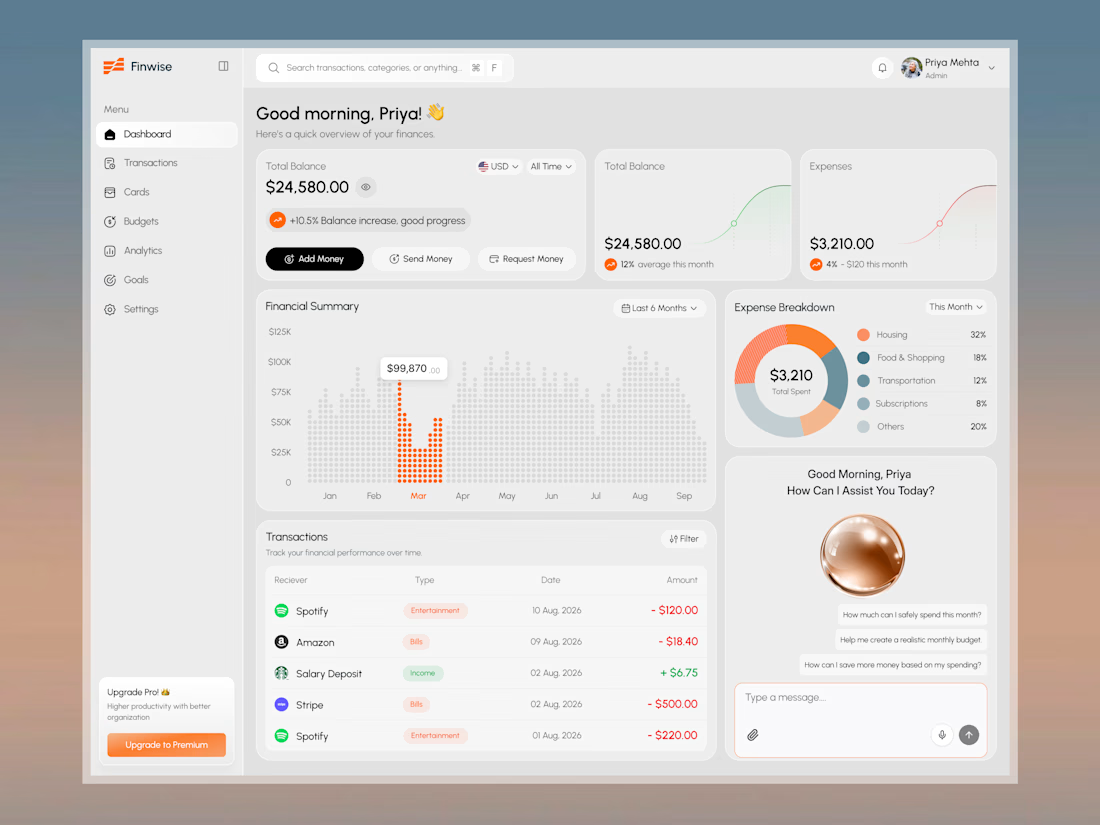
Finwise: Smart Money Dashboard with AI Assistant

this is amazing . love the visual