The network for creativity
Join 1.25M professional creatives like you
Connect with clients, get discovered, and run your business 100% commission-free
Creatives on Contra have earned over $150M and we are just getting started
Back to feedPost

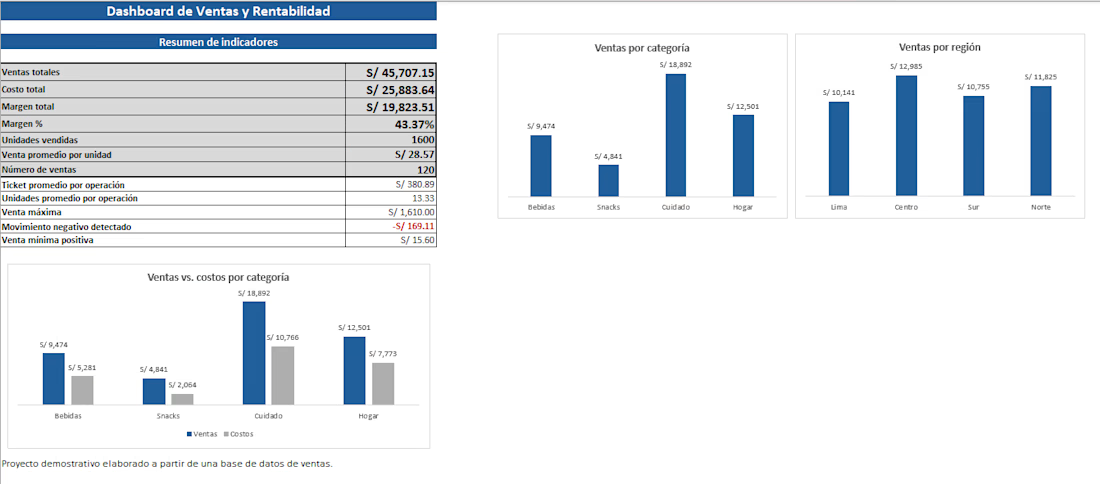
I built this Excel dashboard to analyze sales and profitability from a structured business dataset. It brings together key indicators such as sales, costs, margins and profitability, with comparisons by category and region. The goal was to turn the raw data into a clear view of business performance and make relevant results and unusual movements easier to identify.

The network for creativity
Join 1.25M professional creatives like you
Connect with clients, get discovered, and run your business 100% commission-free
Creatives on Contra have earned over $150M and we are just getting started








Related posts

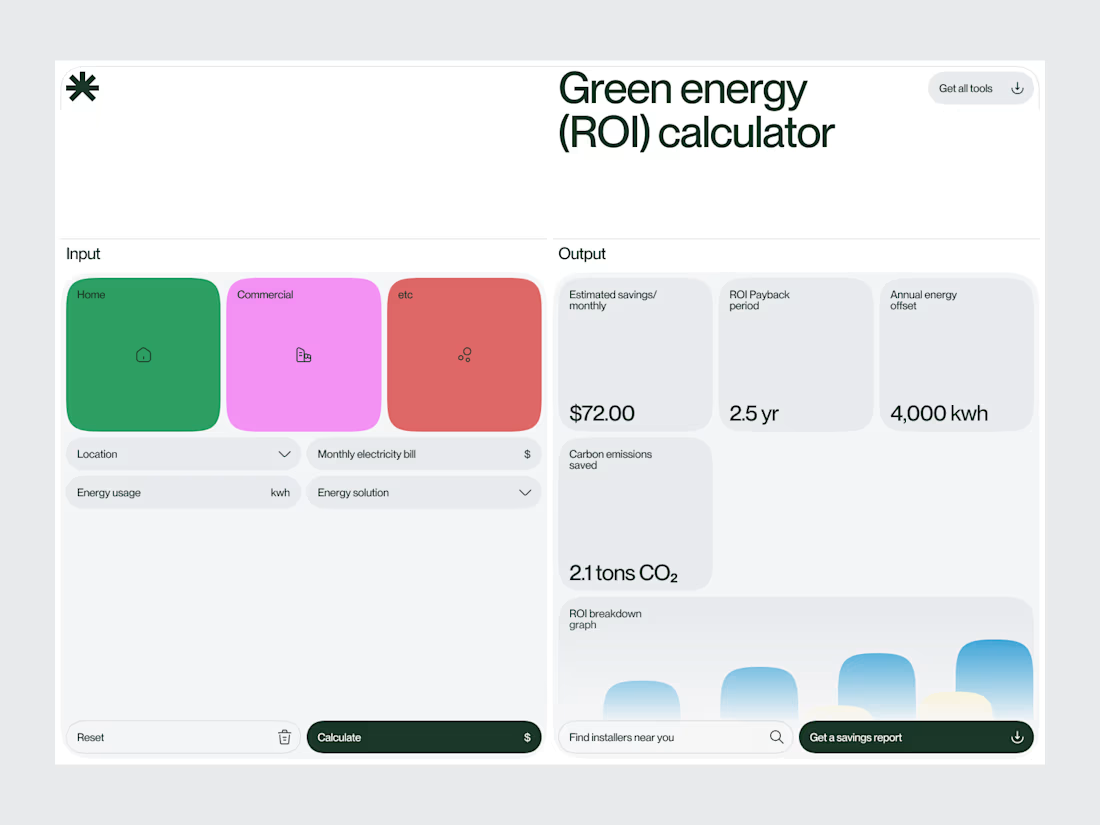
Green Energy ROI Calculator SaaS — UI/UX Design
A SaaS product concept focused on helping users evaluate the financial side of renewable energy investments through a clear, data-focused interface.
The design direction prioritises making important financial information easier to compare and interpret.
Design focus:
Energy investment and cost breakdowns
Potential savings and projected returns
ROI and payback period visualisation
Clear data hierarchy
Practical dashboard interactions
Designed for the intersection of clean-energy technology, financial analysis, and SaaS product experience.
Building a climate-tech or energy SaaS product?
Explore WaxyWeb at www.waxyweb.com


Clear hierarchy. I'd put the savings number even bigger, that's the one thing people screenshot and send to their boss.

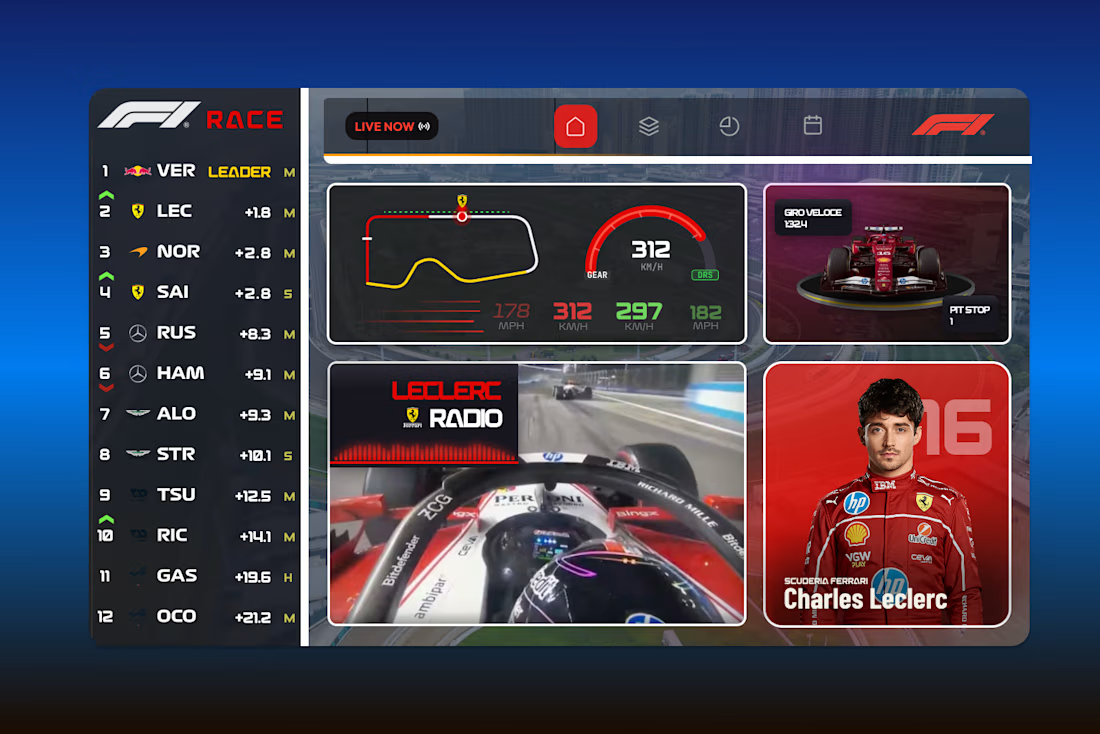
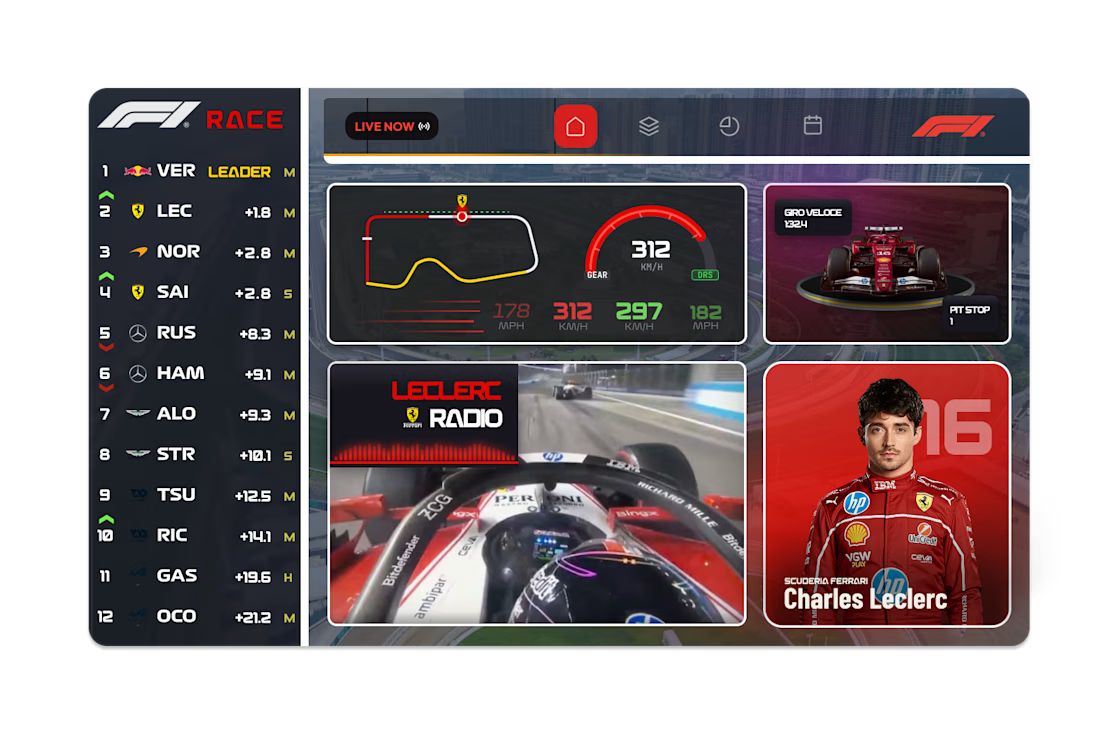
F1 Live Race Dashboard - UI Concept
A live race dashboard concept designed for fans who want the full picture at a glance. Real-time leaderboard, track position, speed and gear telemetry, team radio and driver spotlight, all in a single bento-style layout.


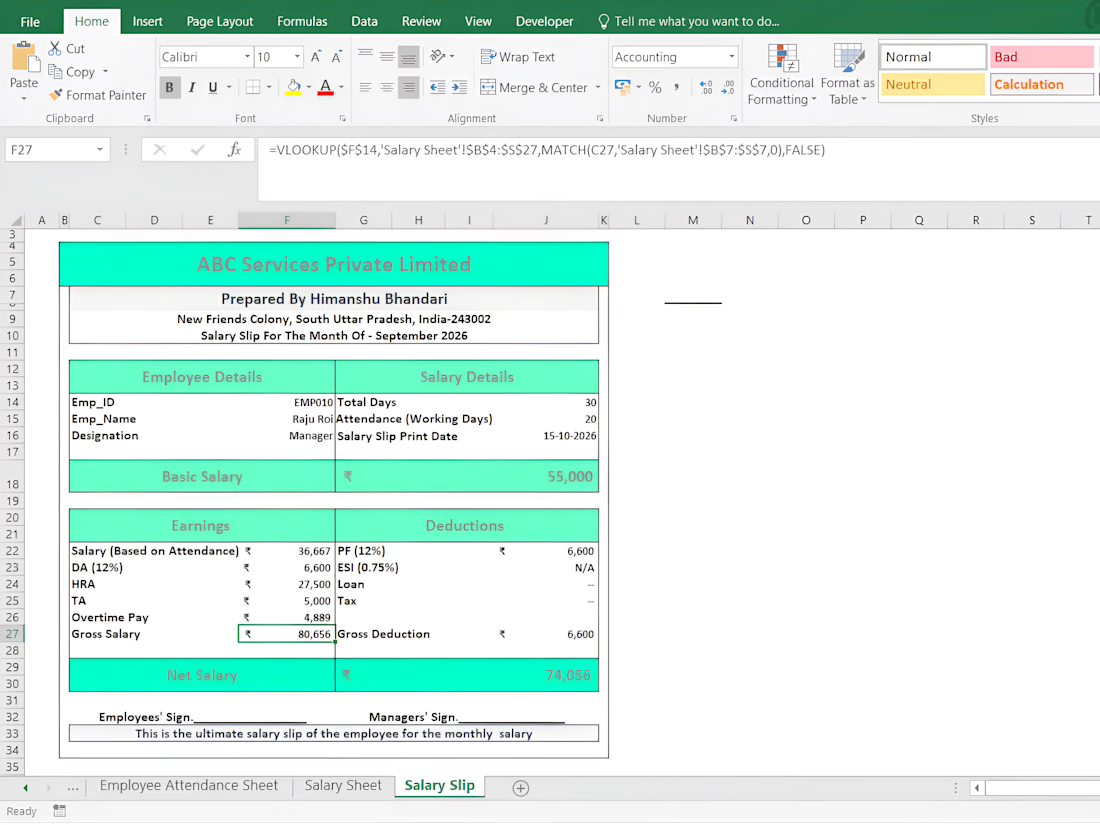
An automated, print-ready Employee Pay Slip Generator built in Excel using dynamic lookup formulas (VLOOKUP + MATCH). It seamlessly pulls live attendance and salary data to auto-populate detailed employee pay stubs—complete with earnings breakdown, statutory deductions (PF & ESI), overtime pay, and net salary summary.
Key Skills: Excel Automation, Dynamic Pay Slip Templates, Payroll Processing, Data Lookup & Linking, Print-Ready Financial Reporting.