The network for creativity
Join 1.25M professional creatives like you
Connect with clients, get discovered, and run your business 100% commission-free
Creatives on Contra have earned over $150M and we are just getting started
Back to feedPost

Use this simple formula when conversing with execs. its simple, easy to pin point your thoughts and gets the team aligned fast

The network for creativity
Join 1.25M professional creatives like you
Connect with clients, get discovered, and run your business 100% commission-free
Creatives on Contra have earned over $150M and we are just getting started


Related posts


5 signs your team has outgrown its spreadsheet 👇
Three versions of the same file. “Orders_final_v2” vs “Orders_FINAL_use_this”. Nobody knows which one is right.
Copy-paste between sheets. Every copy is a chance for a #REF! error.
Everyone can edit everything. One wrong click and 70 rows are gone.
It takes forever to open. Your team waits before they can even start working.
Reports are rebuilt by hand. Someone loses hours every week making the same chart.
Quick rule: 1 or 2 of these? Keep the spreadsheet. 3 or more? It’s quietly costing you more than a simple dashboard would.
How many of these does your team have? 👇

Those duplicate files are a clear sign.

📊 Turning messy spreadsheets into meaningful insights!
Working with data doesn't have to be complicated.
I’m now offering Excel Data Analysis services on Contra, helping individuals, startups, and businesses organise their data and understand what it reveals.
Here's what I can help with:
• Data cleaning and organisation
• Descriptive data analysis
• Charts and visualisations
• PivotTables
• Summary reports
My goal is simple: make your data easier to understand and use.
Interested? Explore my service here: https://contra.com/s/llFZQUmc-excel-data-analysis-or-data-cleaning-organisation-and-reporting
#Excel #DataAnalysis #DataVisualization #Freelancing #Contra
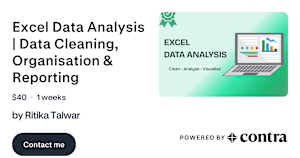
contra.com
Excel Data Analysis | Data Cleaning, Organisation & Reporting by Ritika Talwar
Read more about Excel Data Analysis | Data Cleaning, Organisation & Reporting by Ritika Talwar on Contra.

This product film had about 30 seconds to explain an agentic threat-intelligence platform to a security team. Most of an agent's work happens off screen.
I put the 11 agents on two scrolling rows of cards, in the order they work, so the size of the suite reads in a few seconds. Then the film stays on one task: the assistant writes a report, and the analyst types a follow-up.
This clip is the opening and the report scene. The full film is on my profile.
Launching a product or a feature? Send me what it is and the date.
