The network for creativity
Join 1.25M professional creatives like you
Connect with clients, get discovered, and run your business 100% commission-free
Creatives on Contra have earned over $150M and we are just getting started
Back to feedPost

The goal was to develop a Python desktop application that goes beyond basic cryptocurrency price tracking by combining market monitoring, technical analysis, and strategy research in a unified interface.
I built Pulse Quant using Python and Tkinter, with interactive financial charts and a dark, modern UI. The application integrates public Binance market data, candlestick visualizations, EMA trend analysis, RSI momentum monitoring, market-regime classification, and rule-based BUY/SELL/HOLD signal explanations. It also includes a strategy backtesting interface with configurable RSI thresholds, simulated transaction fees and slippage, performance metrics, and a strategy-versus-buy-and-hold comparison.
One of the main challenges was presenting multiple analytical components without overcrowding the interface. I refined the layout, adjusted chart proportions, improved panel spacing, and resolved clipped headings to create a cleaner, more cohesive desktop experience. I also incorporated demo mode and CSV export to support offline exploration and data analysis.
The result is a single-file Python application that brings market visualization and strategy experimentation together in an accessible research workspace, demonstrating practical desktop development, analytical logic, and UI design.


The network for creativity
Join 1.25M professional creatives like you
Connect with clients, get discovered, and run your business 100% commission-free
Creatives on Contra have earned over $150M and we are just getting started



Related posts

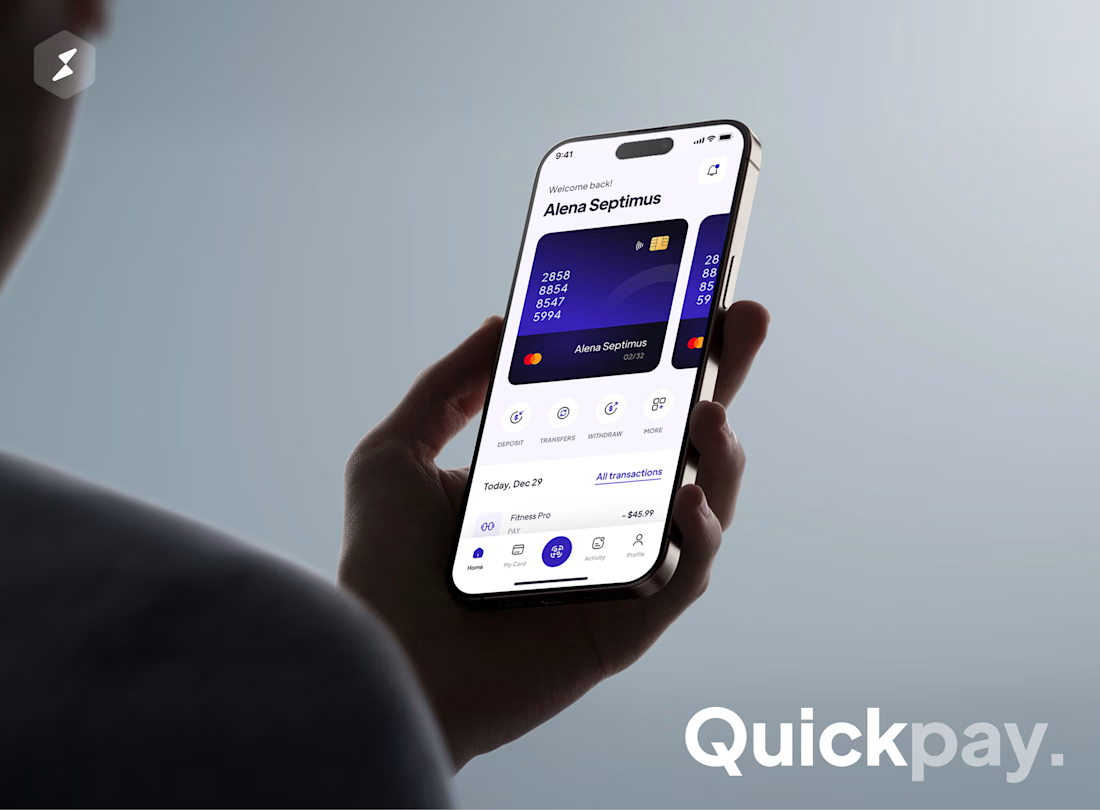
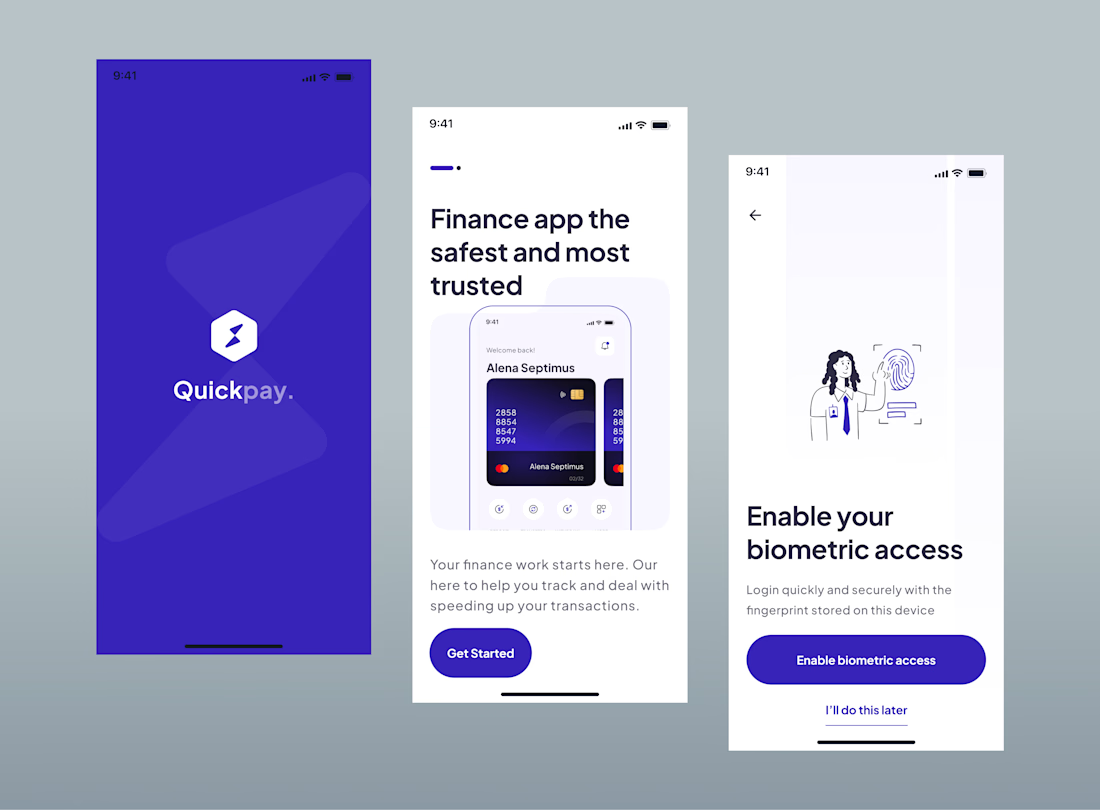
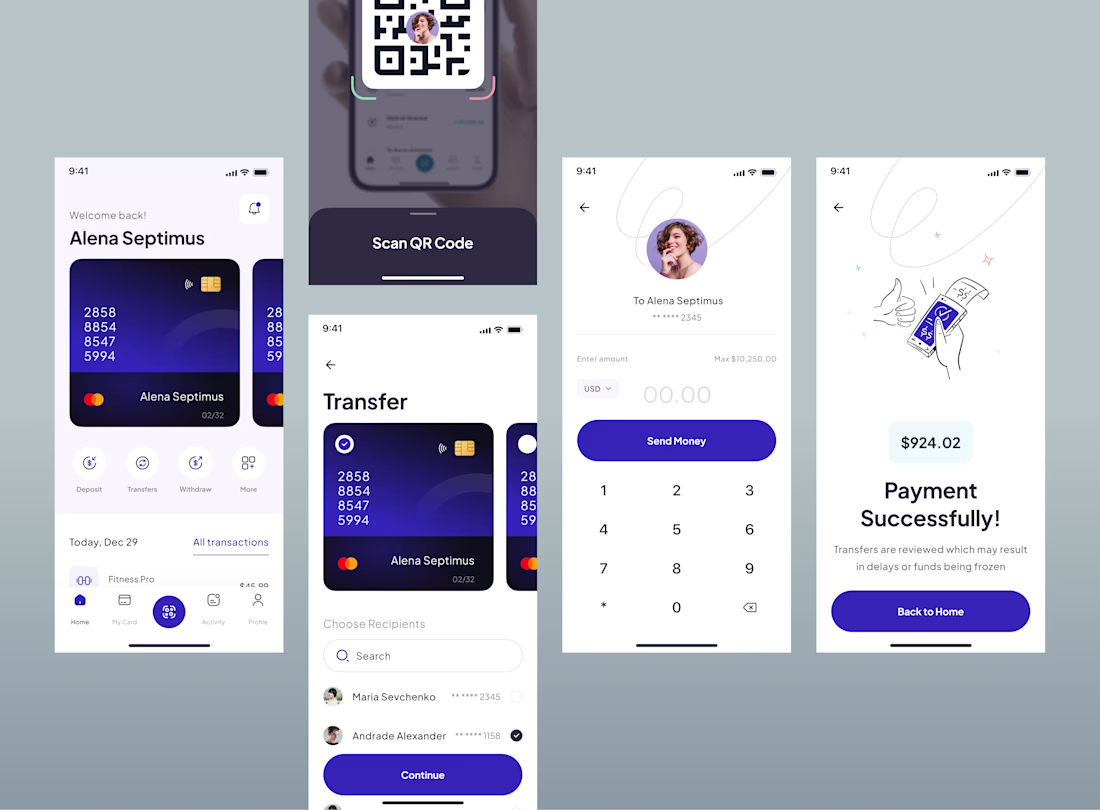
My Weekend Project👇 - Designing a seamless FinTech app UI!
Focused on making QR transfers and digital wallet navigation feel effortless.
What are you building or designing this weekend?


This weekend, I’m working on making financial records cleaner and helping businesses understand their numbers better!😊

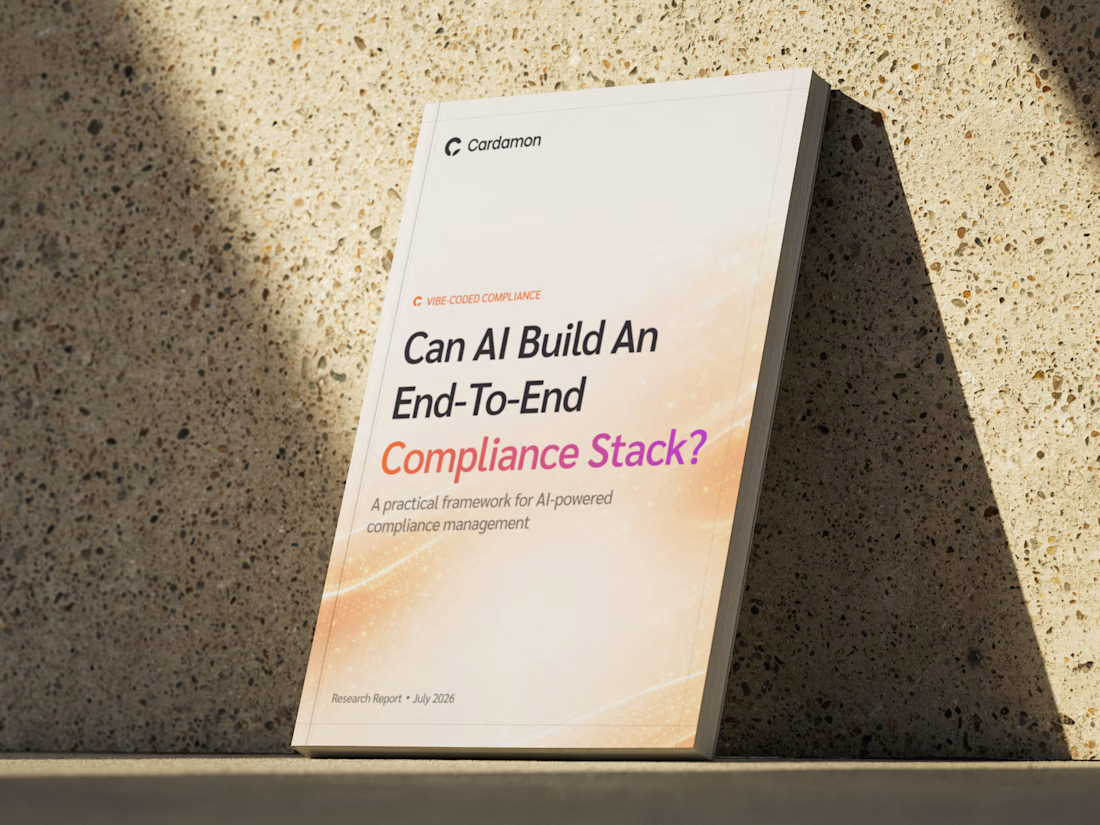
Research eBook & Editorial Design
Can AI build an end-to-end compliance stack?
That’s the question behind Vibe-Coded Compliance, a research report I recently worked on for Cardamon.
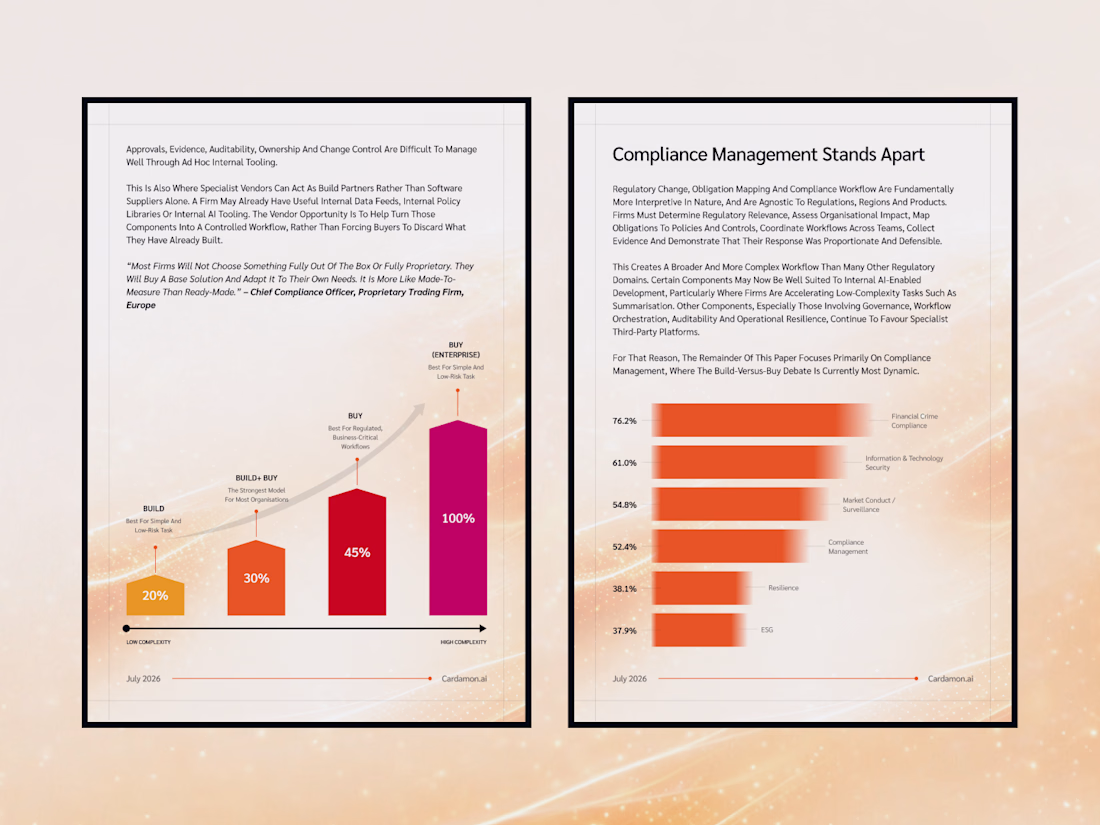
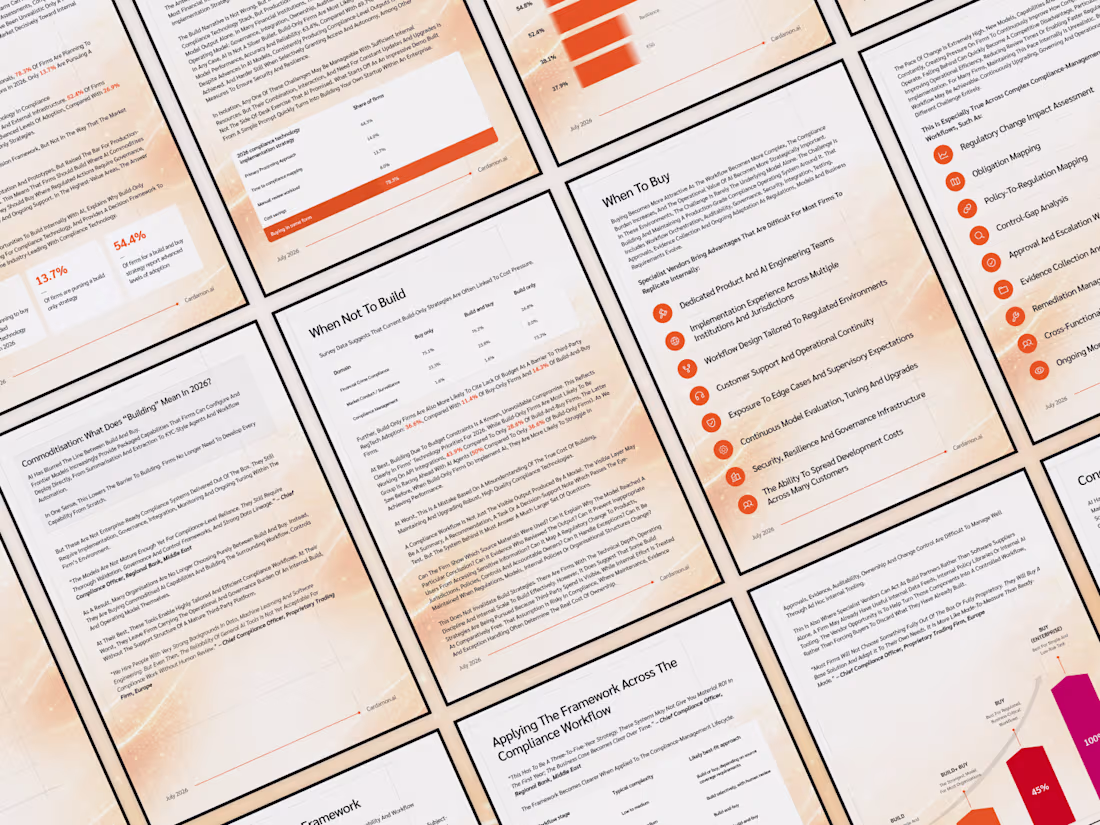
The goal was to make complex research easier to understand through clear layouts, custom data visualizations, and a consistent editorial style.
From detailed comparisons to charts and frameworks, every page was designed to make the information more accessible and engaging.
All brought together in Figma, where I explored different ways to make data-heavy content feel more visual, structured, and enjoyable to read.
Turning complex compliance research into clear, engaging visuals is such valuable work! The charts and structured layouts make a big difference.
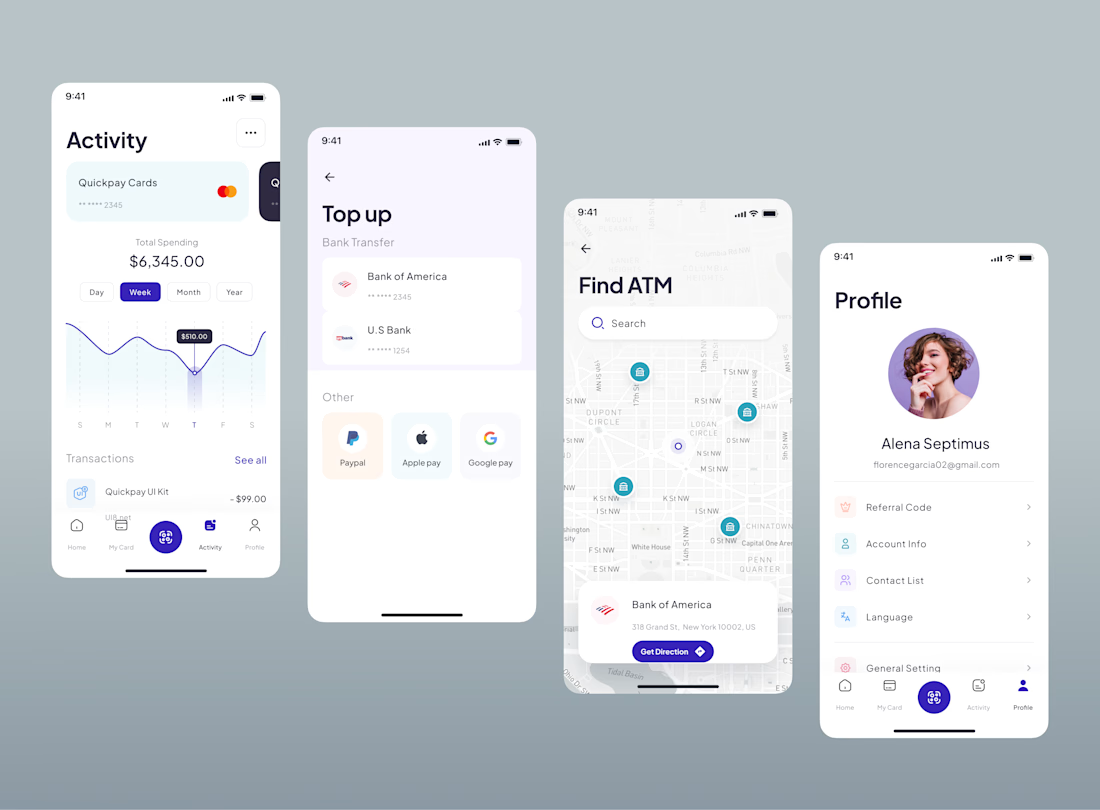
Financial management and utility flow for Quickpay, covering spending activity analytics, multi-method wallet top-ups, map-based ATM discovery, and user profile management.
Looking for a custom UI/UX design for your Fintech platform or SaaS product? Let's collaborate!
Bringing spending insights and everyday wallet tools together makes financial management so much more convenient!