The network for creativity
Join 1.25M professional creatives like you
Connect with clients, get discovered, and run your business 100% commission-free
Creatives on Contra have earned over $150M and we are just getting started
Back to feedPost

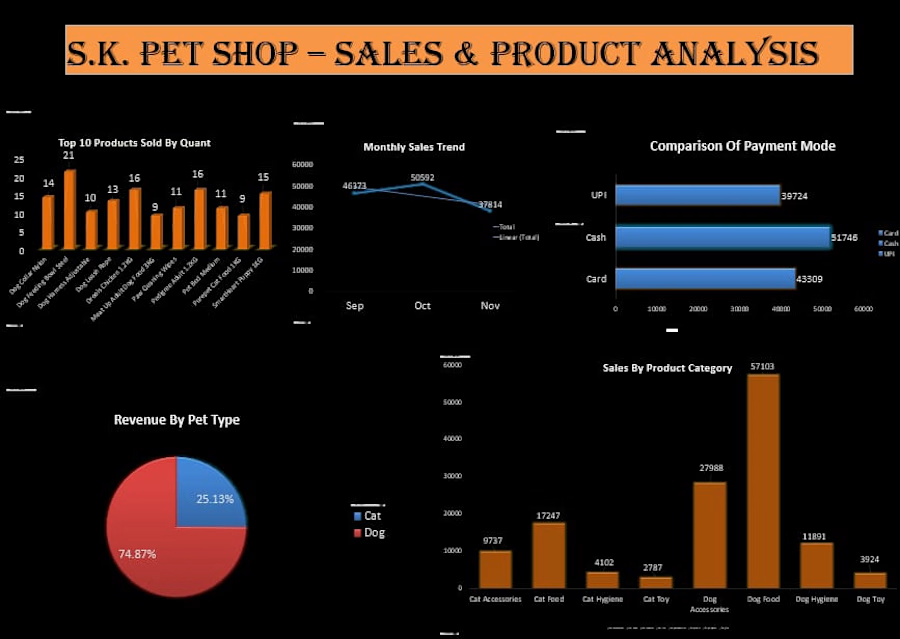
Created this dashboard to provide a visual overview of product sales, monthly sales trends, payment methods, revenue by pet type, and sales performance across product categories.
Key Insights Visualized
📊 Top 10 products by quantity sold
📈 Monthly sales trend
💳 Payment mode comparison — UPI, Cash & Card
🐶🐱 Revenue contribution by pet type
🛍️ Sales by product category
📌 Product-level sales comparison
Tools & Skills
Microsoft Excel | Data Analysis | Data Visualization | Charts | Dashboard Design | Business Reporting
The goal was to make raw sales data easier to interpret and help a business quickly identify popular products, sales trends, customer payment preferences, and revenue patterns.
I can create customized Excel dashboards for sales, marketing, finance, inventory, operations, and business performance analysis.

The network for creativity
Join 1.25M professional creatives like you
Connect with clients, get discovered, and run your business 100% commission-free
Creatives on Contra have earned over $150M and we are just getting started





Related posts

Designed and built an AI operations dashboard that brings projects, decisions, tasks, research, connected tools, and voice interaction into one clear workspace. The goal is to turn complex workflows into a simple, usable system that helps people see what matters and act faster.




Seeing the voice interaction layer pull data from Supabase into the dashboard cuts down on manual context switching.


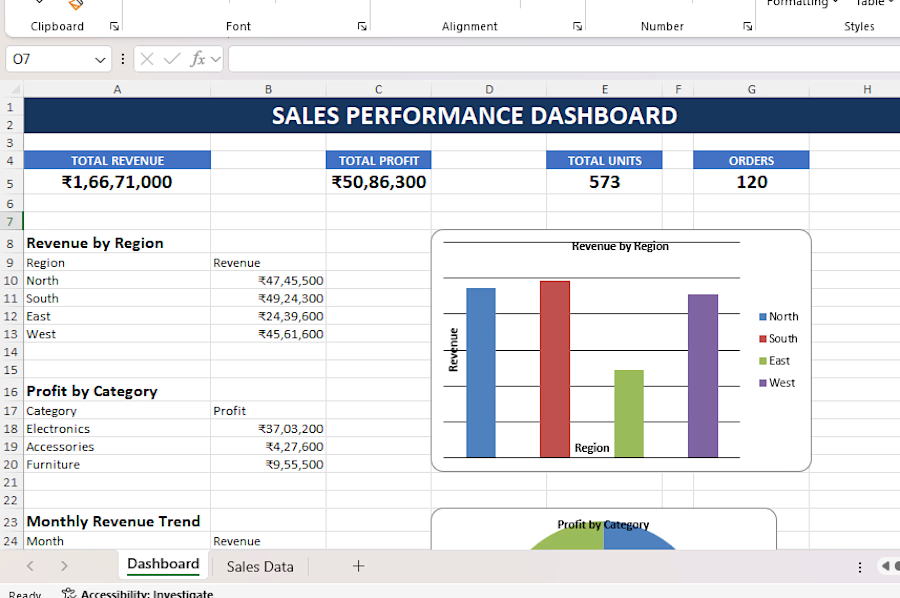
Excel Sales Performance Dashboard
Designed a professional Excel sales dashboard to analyze business performance using realistic sample data. The workbook includes automated revenue and profit calculations, regional sales analysis, product/category performance, KPI summaries, and monthly revenue trends.
Built with Excel tables, formulas, conditional formatting, and interactive-style dashboard visualizations to make business data easier to understand and present.