The network for creativity
Join 1.25M professional creatives like you
Connect with clients, get discovered, and run your business 100% commission-free
Creatives on Contra have earned over $150M and we are just getting started
Back to feedPost
I’m currently building out a Strategic Supply Chain Intelligence Dashboard that bridges the gap between raw database management and executive decision-making. This isn’t just about making "pretty charts" it’s about solving real-world operational bottlenecks.
Logistics Efficiency: Carrier B is our clear winner, maintaining a 5.3-day average shipping time, outperforming all others without a significant jump in cost.
Supplier Risk vs. Reward: While Supplier 1 is a model of reliability (14.8-day lead time), Supplier 5 is a major bottleneck with 18-day delays and higher-than-average defect rates.
The Quality Bottleneck: A staggering 41% of inspections are currently "Pending." This suggests that our production isn't just a manufacturing challenge, but a quality control one.
Revenue Drivers: Skincare isn't just a category; it’s our powerhouse, generating over $241K in revenue.
What I’ve achieved in this phase:
Database Engineering (MySQL): Cleaned and transformed messy supply chain data, moving past "Incorrect DECIMAL" errors and encoding issues to create a math-ready schema.
KPI Development: Built out core metrics including Net Profit, Supplier Lead Times, and Defect Rates to track manufacturing health.
Operational Intelligence: Identified that Carrier B is our logistics powerhouse (5.3-day avg), while Supplier 5 poses a significant risk to the supply chain with 18-day delays.
Advanced Visualization (Power BI): Developed a dark-themed, futuristic dashboard focused on high-level executive cards and correlation line charts.
There are still a few "pending" items to fix (like that 41% inspection bottleneck!), but this project marks the biggest "jump" in my technical journey so far. I’m staying "Locked In" to ensure the final result is bulletproof.
Tools used: 🛠️ Excel (Data Prep) 💻 MySQL (Data Analysis & Cleaning) 📊 Power BI (Business Intelligence)
The network for creativity
Join 1.25M professional creatives like you
Connect with clients, get discovered, and run your business 100% commission-free
Creatives on Contra have earned over $150M and we are just getting started
Related posts
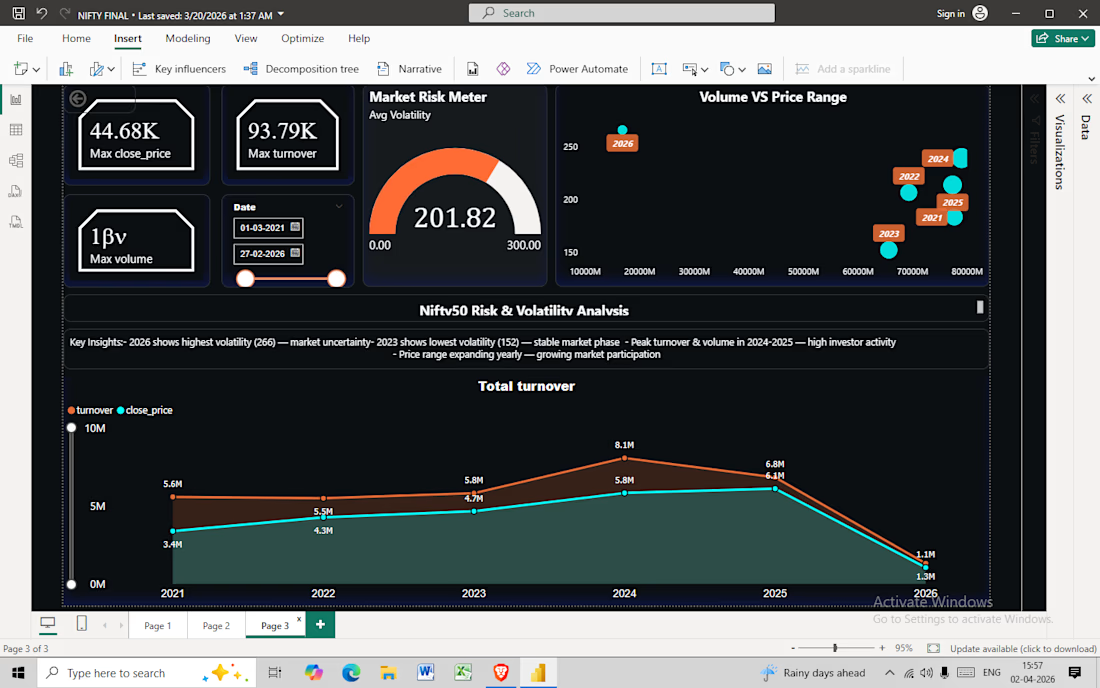
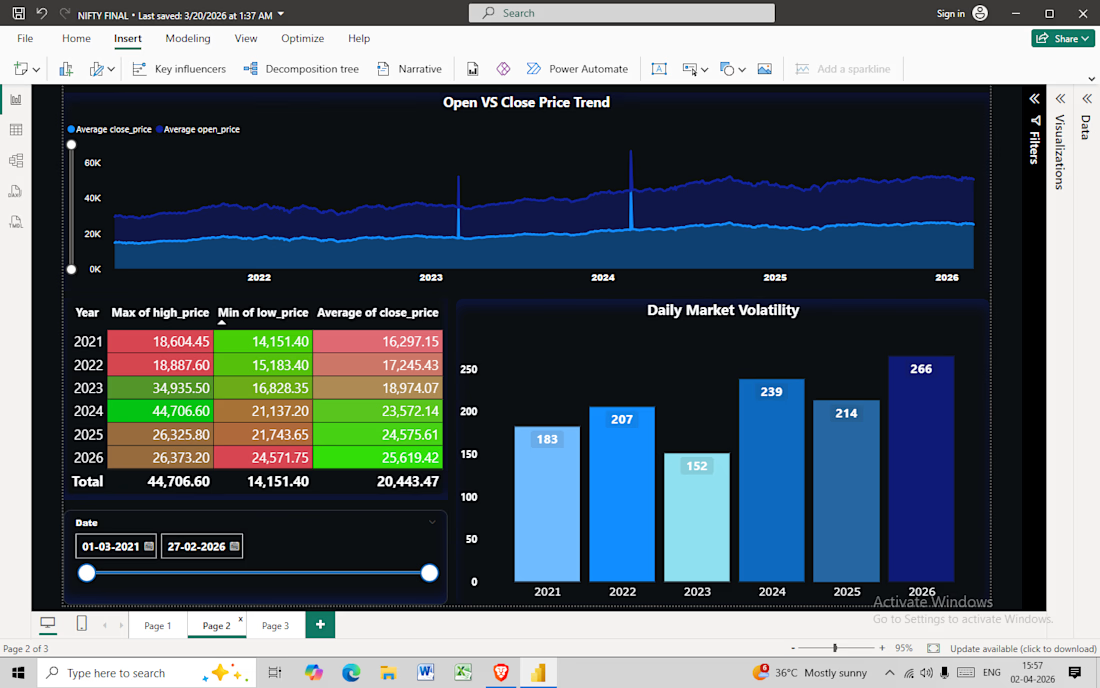
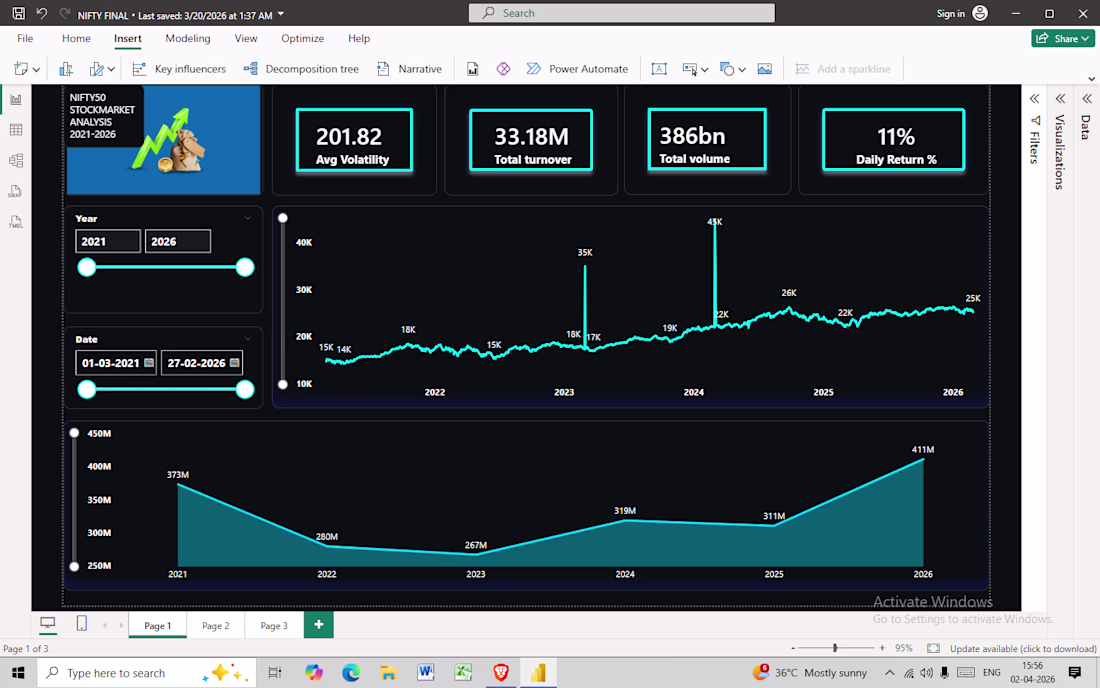
Developed a comprehensive Stock Market Analysis tool using SQL and Power BI to visualize Nifty 50 data.
Data Processing: Cleaned and transformed raw financial datasets using Excel and SQL queries.
Interactive Visuals: Built 3 dynamic dashboards tracking price trends, volatility, and sectoral rotations.
Business Insights: Identified key market drivers and risk factors through historical data analysis.
Financial Expertise: Proven experience in stock market data analysis (Nifty 50).
Tech Stack: Power BI, SQL, Microsoft Excel.
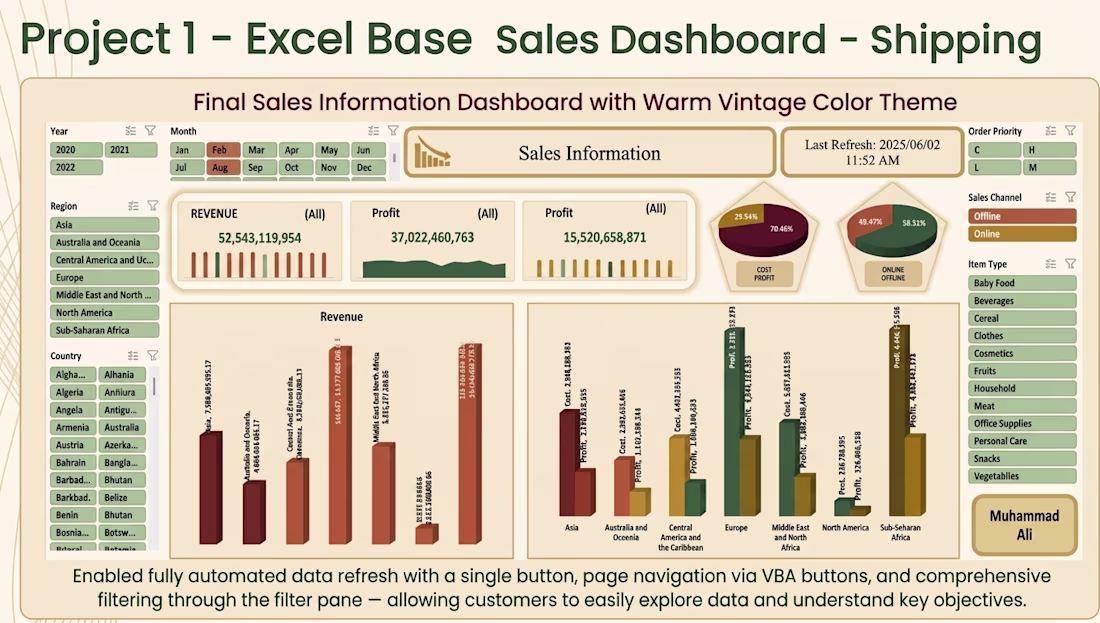
Interactive Sales Dashboard | Excel BI with Dynamic Filters & VBA
Hi, I'm Muhammad Ali.
I built this Excel dashboard because I saw too many business owners drowning in spreadsheets — rows and rows of data, but no clear answers.
So I created something different.
📊 What This Dashboard Does
It takes raw shipping/sales data and turns it into a simple, interactive dashboard. Click a button. Filter by year, region, or product. Instantly see your revenue, profit, and margins.
No complicated software. No coding. Just Excel.
🔍 What You Can Do With It
Filter by Year (2020, 2021, 2022), Month, Region, or Country
Get real-time updates on total revenue and profit.
Quickly check the margin %
Separate performance into 12 or more product categories, such as baby food, drinks, clothes, and so on.
Compare sales channels that are online and offline
Sort by Order Priority (C, H, L, or M)
⚙️ What Makes It Unique
One-click data refresh: update everything with just one click
VBA-powered navigation — move between pages easily
Pivot tables with slicers — instant filtering, no formula errors
Clean, warm-vintage color theme—comfortable for all-day use
Last refresh timestamp — so you always know your data is current
📈 Real Insights You Can Get
Total Revenue: $52.5B+
Overall Profit Margin: ~29.5%
Which regions are performing best?
Which product categories drive the most profit?
How do online and offline sales compare?
📎 What You'll Receive
Fully editable Excel file (.xlsx or .xlsm)
Simple PDF guide (how to use the dashboard, how to refresh data)
💼 Who Is This For?
Business owners who want to understand their sales without hiring a data team
Operations managers who need fast answers
Anyone tired of messy spreadsheets
👨💻 Built by me, Muhammad Ali
I focus on making data useful — not just pretty. If you need a custom dashboard for your business, I'd love to help.
📬 Message me on Contra to get started.
This is clean and very well executed. You made it look effortless, which usually means a lot of work happened behind the scenes. Can you walk us through how you approached it from start to finish?
Built a retail analytics system focused on customer churn and business insights.
This project is not just a dashboard. It combines data processing, analysis, and business interpretation into one system.
What this project does:
• Analyzes retail transaction data
• Identifies patterns behind customer churn
• Highlights key drivers affecting retention
• Transforms raw data into decision-ready insights
System flow:
Raw data → Cleaning & transformation → Analysis → Insight generation → Dashboard
Key focus:
• Understanding why customers stop buying
• Turning data into actionable business insights
• Structuring data for reliable analysis
• Supporting retention strategy decisions
What this solves:
Customer churn directly impacts revenue.
This system helps:
• Identify at-risk customers
• Understand behavior patterns
• Support targeted retention strategies
Tools used:
Python | Pandas | SQL | Excel / Power BI
Outcome:
• Clear visibility into customer behavior
• Insight-driven approach to retention
• Structured analytics system for retail data
This is part of a larger goal to build full data systems that connect engineering, analytics, and business impact.
If you need data turned into real business insight, let’s work.
awesome work here
Trending
Runway
AI video generation is exploding. What are you dreaming up in Runway?
Contra University
Learn from expert creatives how to earn more using next-gen AI tools.
creativeaiflow
Creative AI workflows are evolving. What tools do you use, and what are their strengths and weaknesses?
portfolioreview
The best portfolios tell a story, not just show a grid. Share yours for feedback.
freelancerlife
Freelancer life is wins, pivots, and everything in between. What’s yours right now?