The network for creativity
Join 1.25M professional creatives like you
Connect with clients, get discovered, and run your business 100% commission-free
Creatives on Contra have earned over $150M and we are just getting started
Back to feedPost

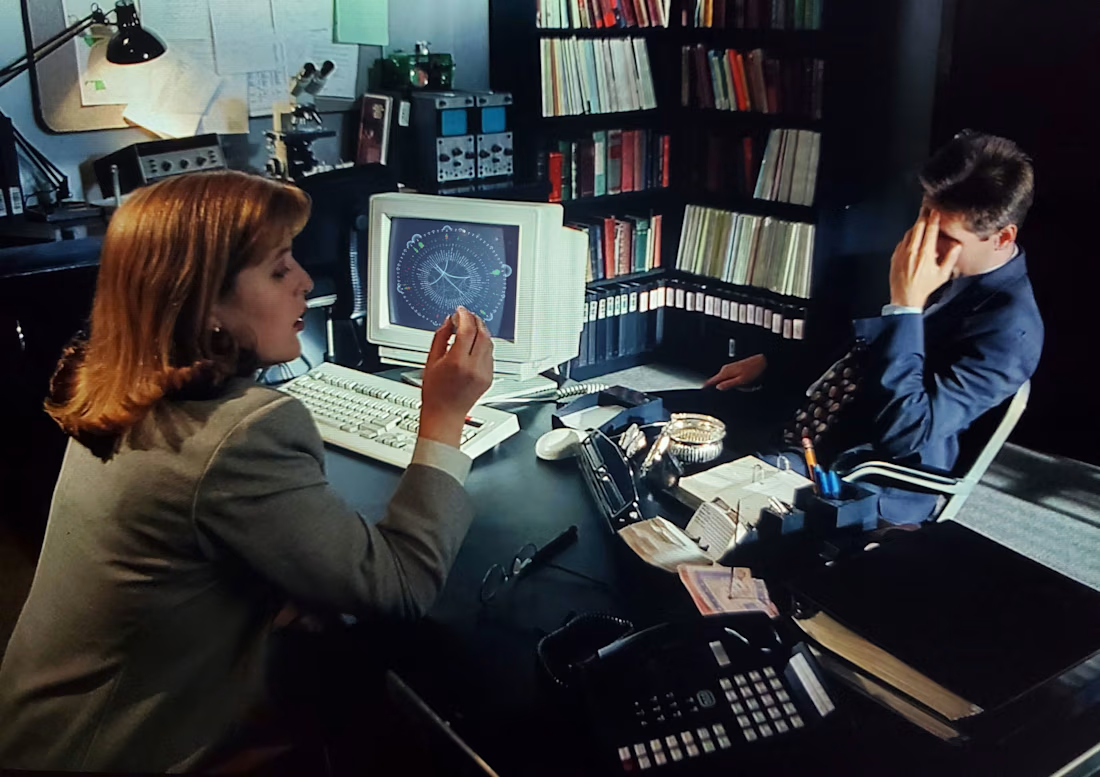
The truth is out there—and data visualization is the lens that helps us find it. 🕵️♂️📈👽
Great data design doesn’t just look beautiful. It acts as a powerful tool to uncover hidden connections, investigate complex cases, and reveal stories that would otherwise stay buried in spreadsheet rows.
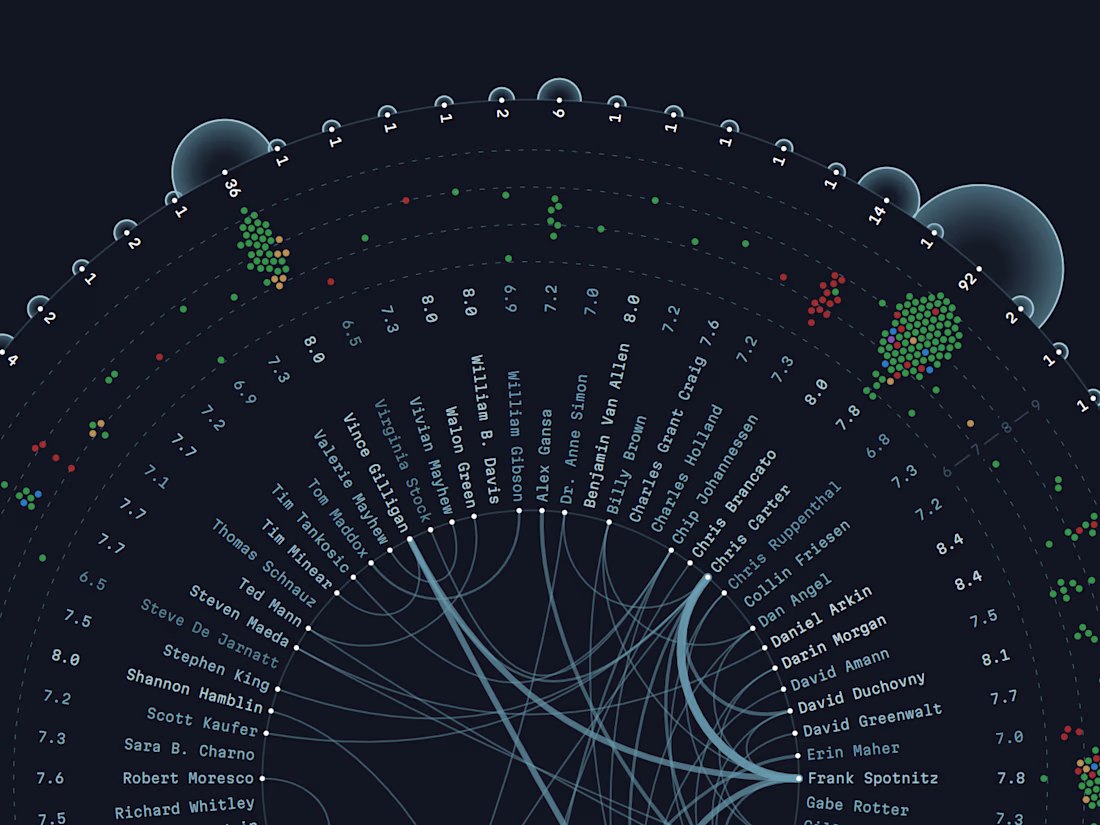
To show this in action, I created a personal project dedicated to the cult show 🛸 The X-Files. I analyzed how different screenwriters collaborated on individual episodes throughout the series and built an interactive visual explorer.
Check the online version to explorer the network of creative minds behind the show's iconic mysteries: https://yanouski.com/projects/xfiles-writers/


The network for creativity
Join 1.25M professional creatives like you
Connect with clients, get discovered, and run your business 100% commission-free
Creatives on Contra have earned over $150M and we are just getting started











Related posts

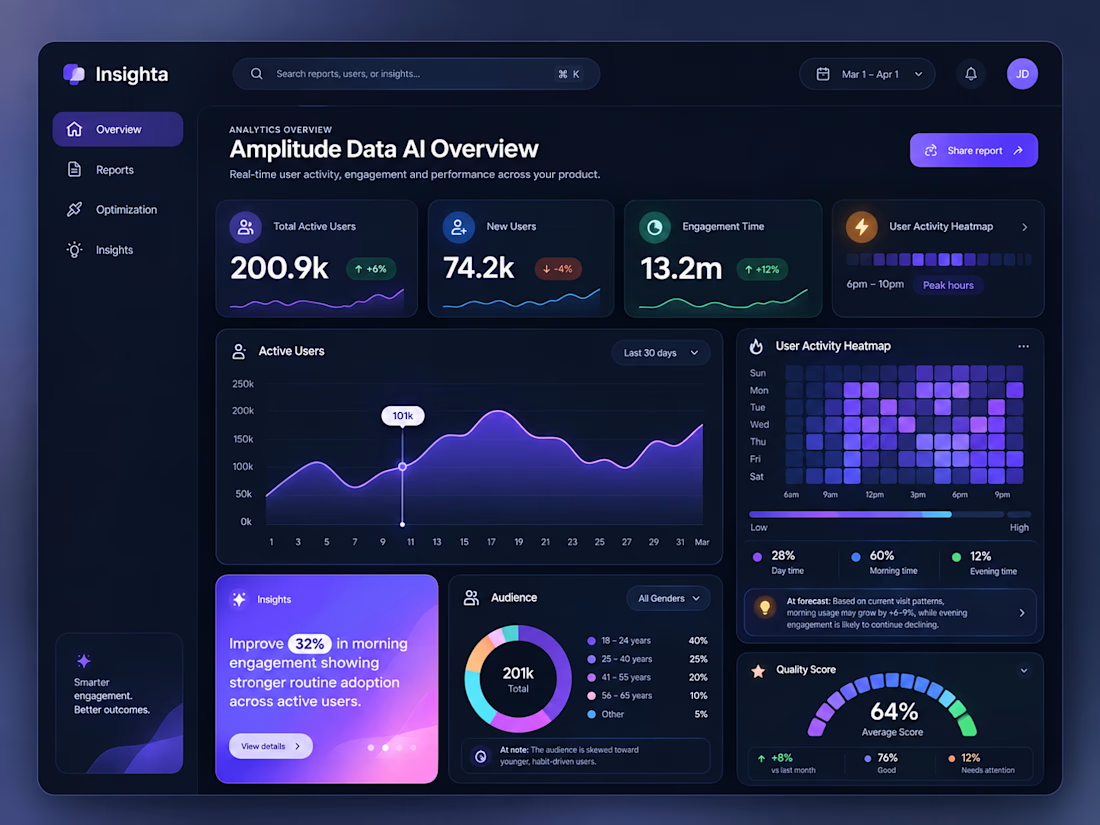
Insighta — AI-Powered Analytics Dashboard UI
Introducing Insighta ✨ — a modern AI-powered analytics dashboard designed to transform complex data into clear, actionable insights.
Featuring real-time user analytics, interactive data visualizations, engagement heatmaps, audience insights, and AI-driven recommendations, this dashboard combines a sleek dark interface with vibrant gradients and intuitive data storytelling.
Designed with a focus on usability, visual hierarchy, and a seamless analytics experience.



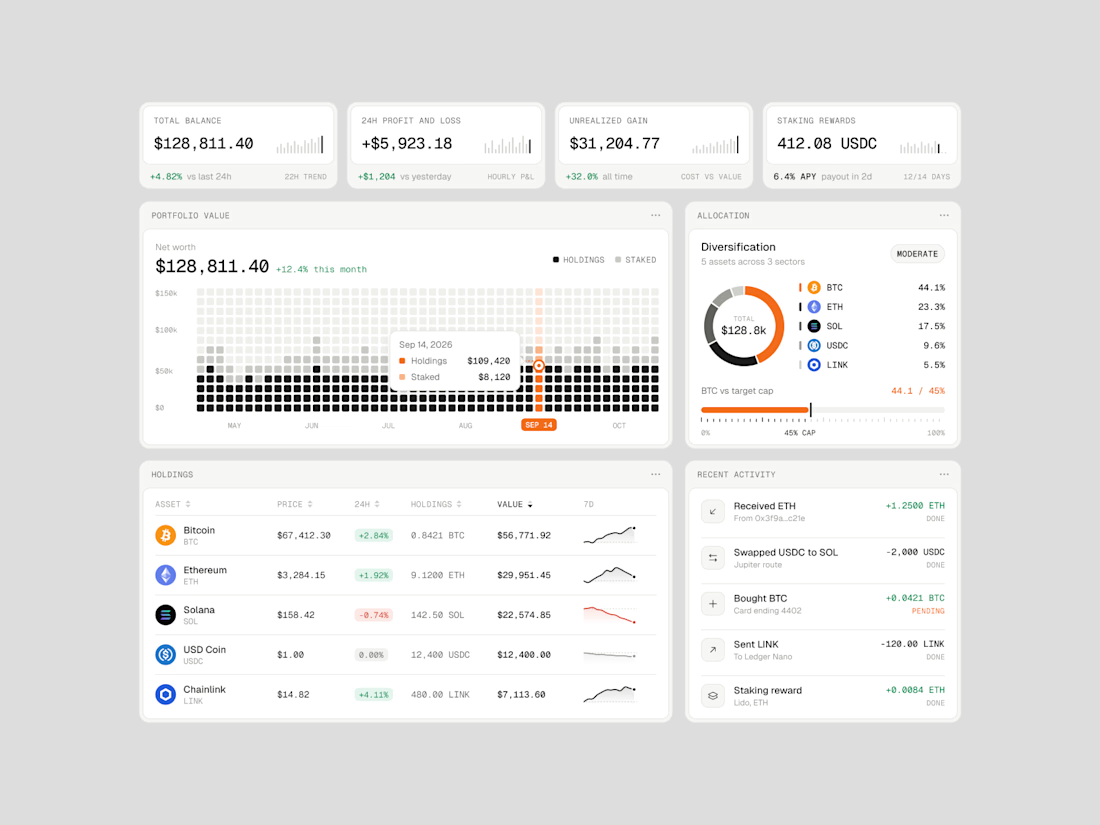
Exploring how complex financial data can feel simple, structured, and easy to navigate.
Vault One is a crypto portfolio dashboard concept that brings together asset performance, portfolio allocation, transaction history, and key financial metrics in one workspace.
I focused on visual hierarchy, information density, and data visualization, using a neutral color palette, subtle UI details, and selective accent colors to keep the interface clean without compromising functionality.
The goal was to make the data easier to understand, not just nicer to look at.
Would love to hear your thoughts on the visual direction and layout!
#ProductDesign #UIDesign #Fintech #DashboardDesign #UXDesign



Personally not a fan of gambling
But the predictions market data is fascinating
Started digging through Polymarket's API and found this back-and-forth in the Ballon d'Or race
So I turned the data into The Chase, a visual story where you can watch expectations shift over time
Codex ran out of credits mid-build. Enjoy the meme