The network for creativity
Join 1.25M professional creatives like you
Connect with clients, get discovered, and run your business 100% commission-free
Creatives on Contra have earned over $150M and we are just getting started
Back to feedPost

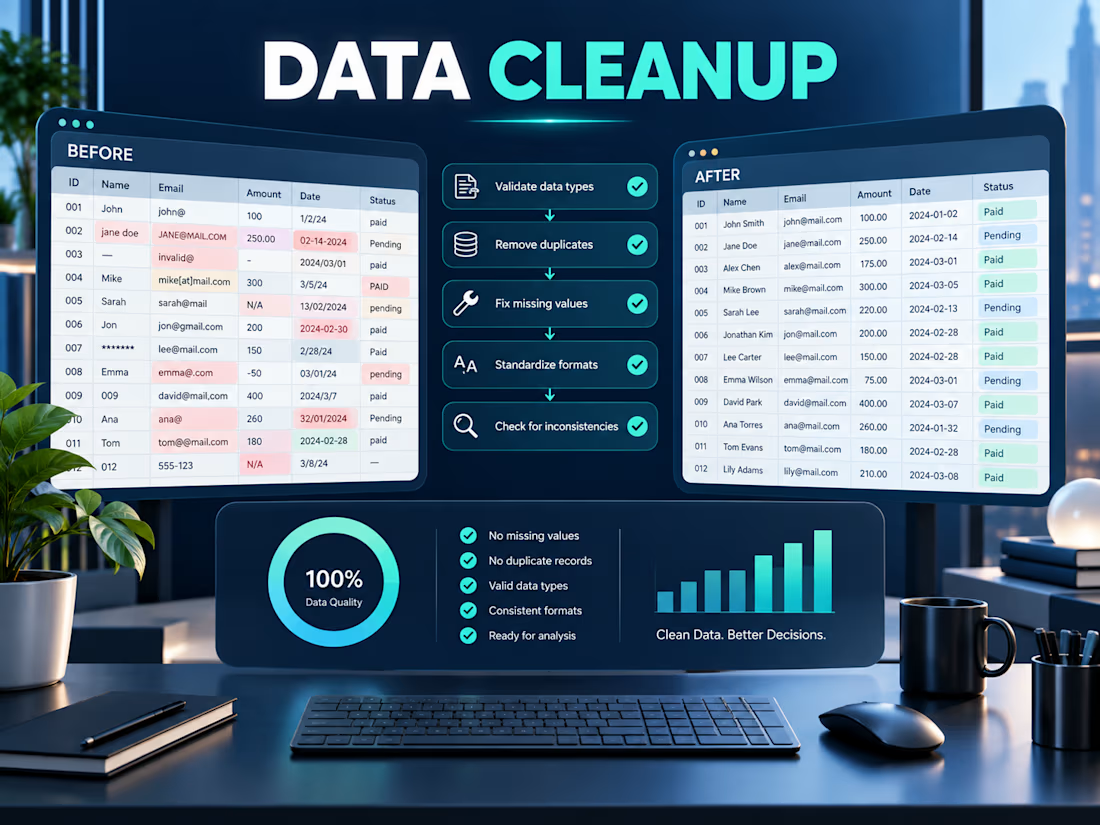
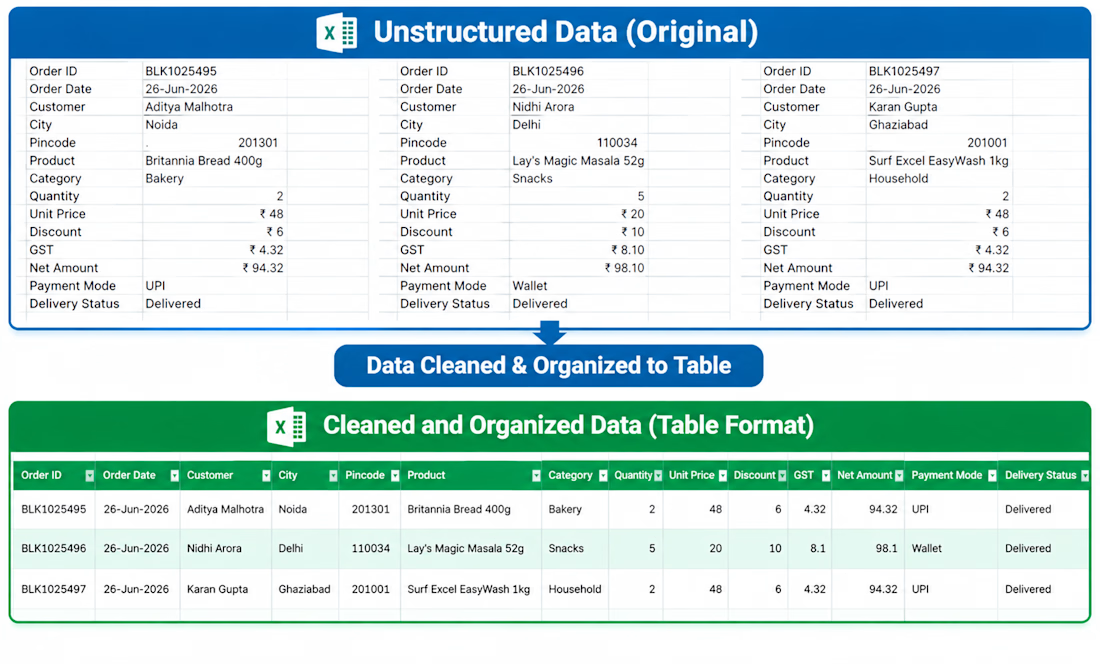
Concept Project — Data Cleanup & QA
A practical example of turning inconsistent spreadsheet data into a clean, structured, analysis-ready dataset using validation rules, duplicate checks, standardized formats, and a final QA pass.

The network for creativity
Join 1.25M professional creatives like you
Connect with clients, get discovered, and run your business 100% commission-free
Creatives on Contra have earned over $150M and we are just getting started





Related posts

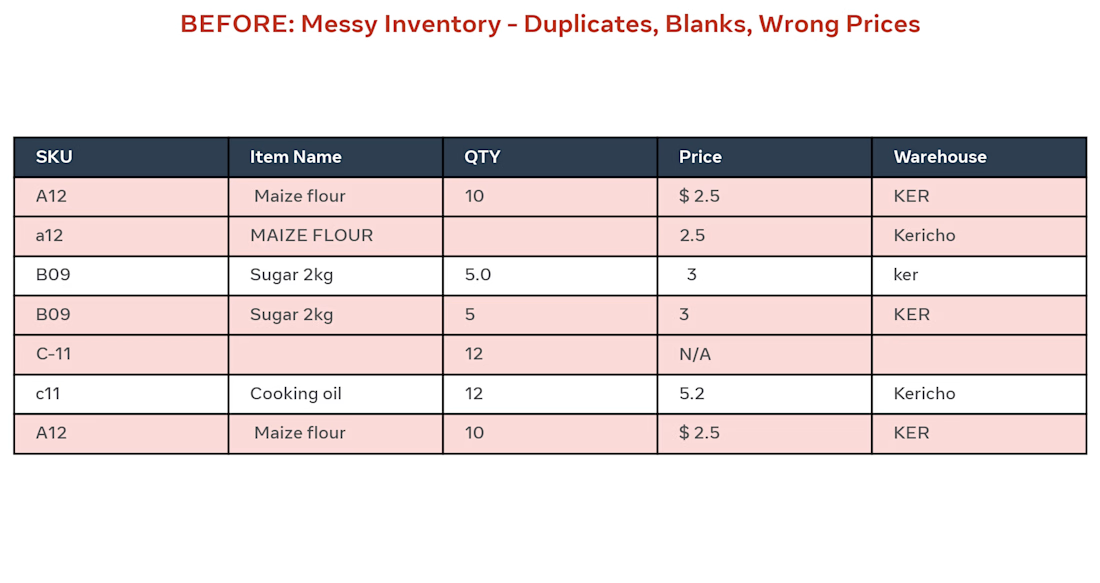
BEFORE: Client had messy Excel inventory with 500 rows, duplicates (A12 / a12), blanks, wrong prices like "$ 2.5" and "N/A", and different warehouse names (KER / ker / Kericho).
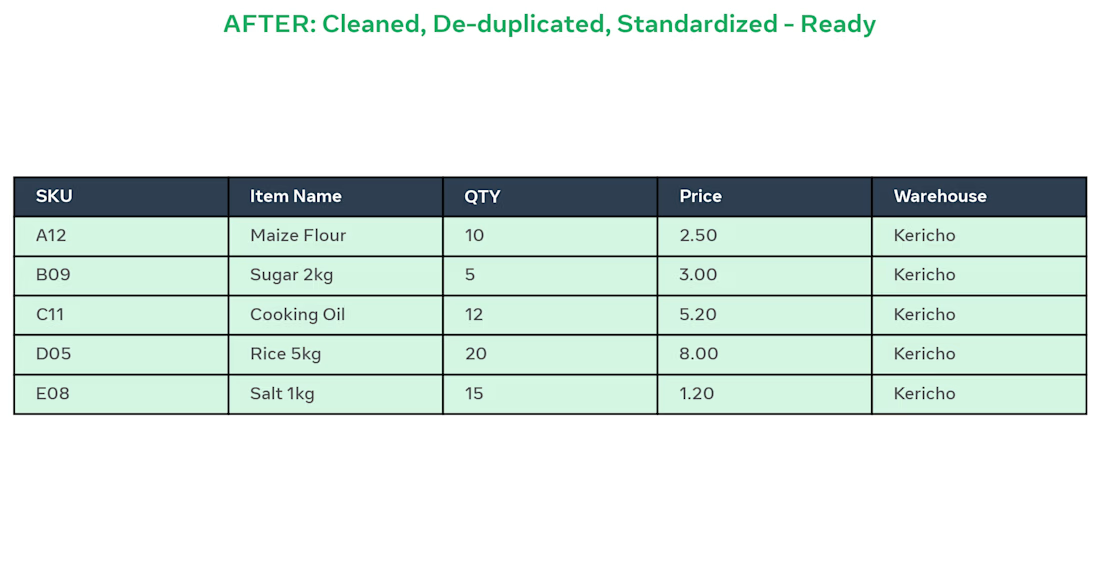
AFTER: I did:
Removed 12 duplicate SKUs
Standardized item names to Title Case
Fixed QTY and Prices to 2 decimals
Unified Warehouse to Kericho
Made sheet ready for pivot dashboard
Result: Clean, ready-to-use inventory in 2 days using Excel.
Tools: Excel, Remove Duplicates, Text to Columns, TRIM, PROPER

Cleaned and formatted a raw dataset in Excel by removing duplicates, fixing formatting issues, handling missing values, and organizing the data into a structured format for analysis.


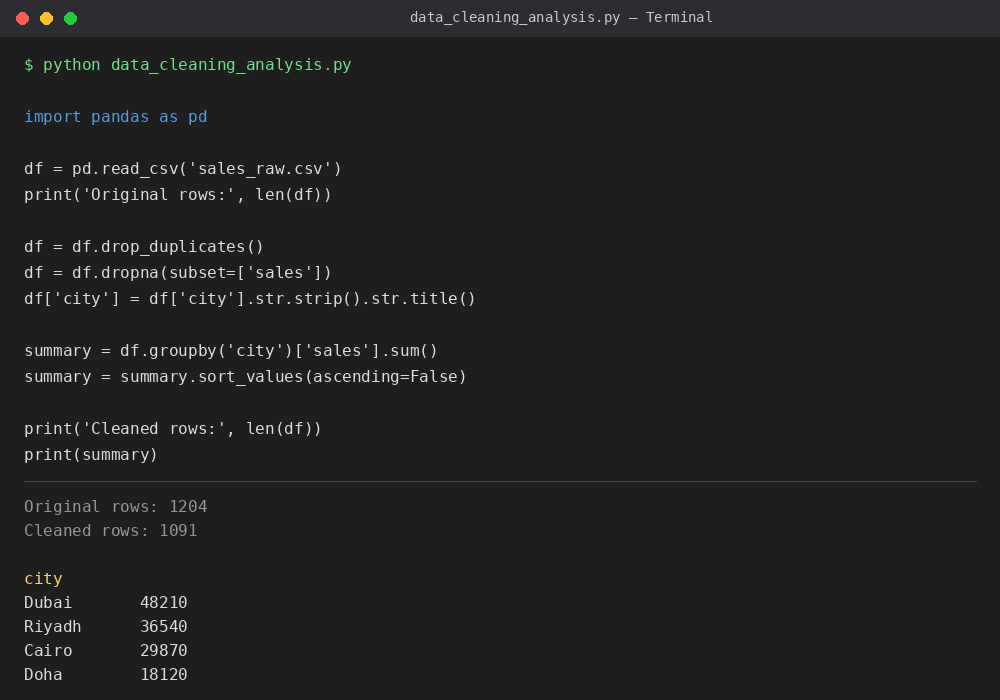
A sample Python project showing my data cleaning workflow — removing duplicates, handling missing values, standardizing text fields, and summarizing sales by city using Pandas. This reflects the kind of cleanup and analysis I do for client datasets.