The network for creativity
Join 1.25M professional creatives like you
Connect with clients, get discovered, and run your business 100% commission-free
Creatives on Contra have earned over $150M and we are just getting started
Back to feedPost

Excited to share some assets I had the pleasure of helping design for Back Market's event in Las Vegas, Worst in Show. The event was happening at the same time as CES (Consumer Electronics Show) in Vegas to draw attention to technology that is not always needed and to premiere their documentarty film DANDORA, which shines a light on the consequences of e-waste.


wonderful design!
Thank you!
The network for creativity
Join 1.25M professional creatives like you
Connect with clients, get discovered, and run your business 100% commission-free
Creatives on Contra have earned over $150M and we are just getting started




Related posts

A modern backend developer portfolio designed and developed in Framer with a clean, technical aesthetic and interactive animations.
Here:- Check it out


Jihanki: a vending machine you can watch
A drink is the oldest companion to a film. So I asked: what if the machine that hands you the drink also played the film?
Jihanki is a Video.js v10 skin shaped like a street vending machine, the kind you find on a corner in almost any city in the world. The video plays behind the glass, so your drink and your show come from the same cabinet.
Every part of the machine is a real control:
• Tap the cabinet to leave a sticker, like on any machine on a real street. Press and hold to peel it off.
• The cans on the shelf are the timeline. Each run of cans is a chapter.
• A dial plays and pauses, a fader sets the volume, a knob mutes.
• Pause, and the machine starts dispensing. When the film ends, one last can drops: take it to replay.
• Eight cabinet colours for eight streets around the world: Tokyo, Seoul, Beijing, New York, London, Paris, Berlin, Rome.
Built with HTML and CSS on Video.js v10, streamed through Mux, keyboard operable, and responsive from desktop to phone.
Live: https://jihanki-player.vercel.app
Website: https://jihanki-showcase.vercel.app/

A street vending machine that hands you the drink and plays the film, so charming.

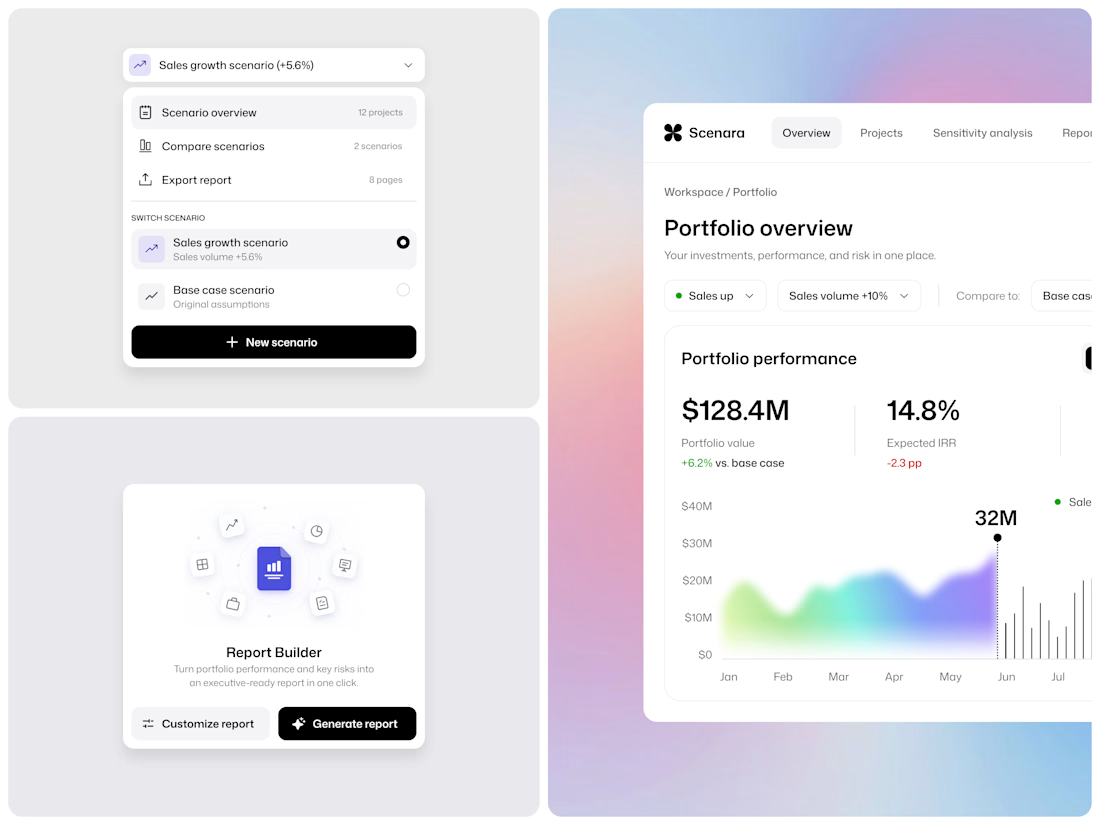
“What if sales drop 10%?” For a portfolio manager working across multiple investment projects, answering that question can mean days of rebuilding spreadsheets.
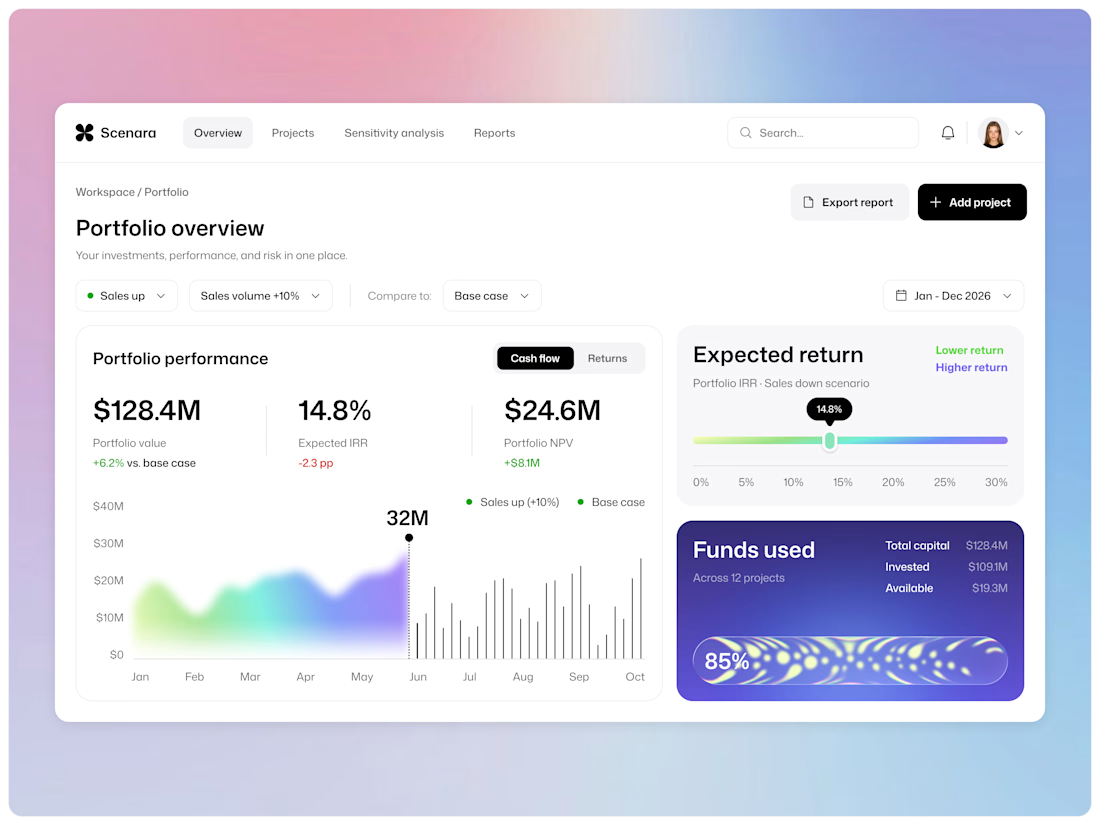
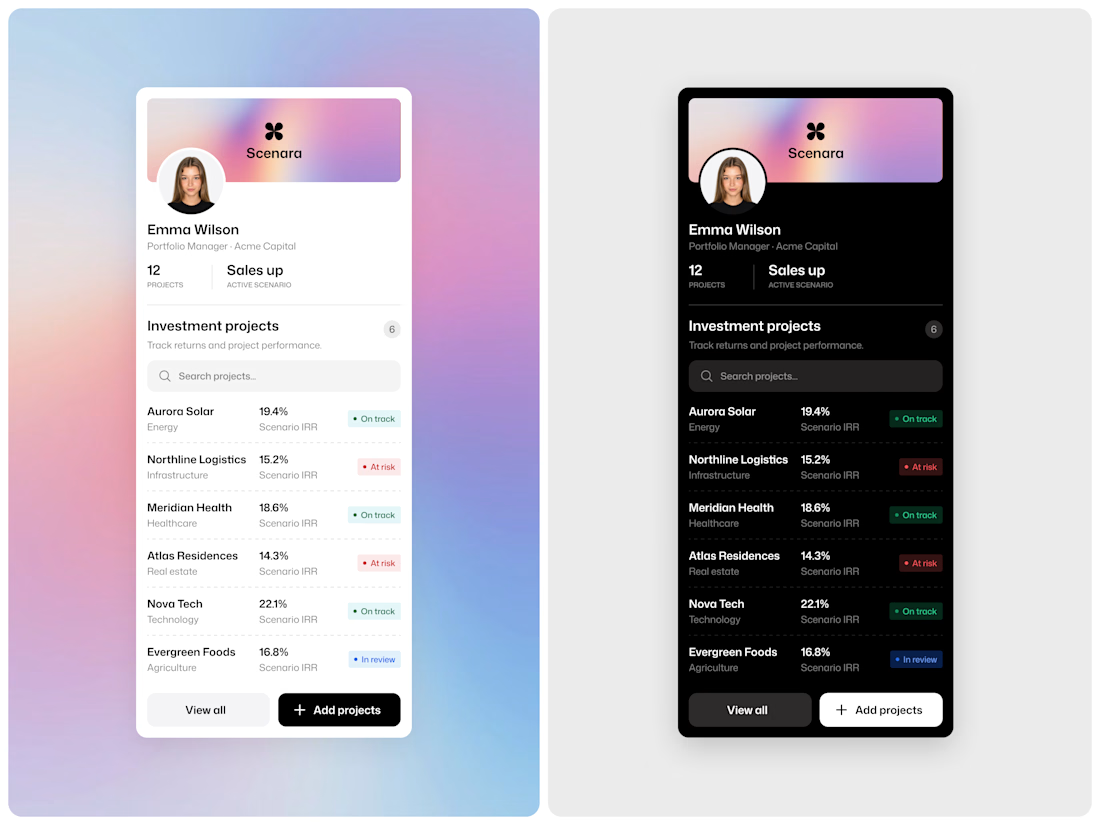
Scenara is an investment portfolio dashboard designed to make scenario analysis faster and clearer. Change one assumption and compare it with the base case. Review project status and returns across a 12-project portfolio. Turn performance and key risks into an executive-ready report.
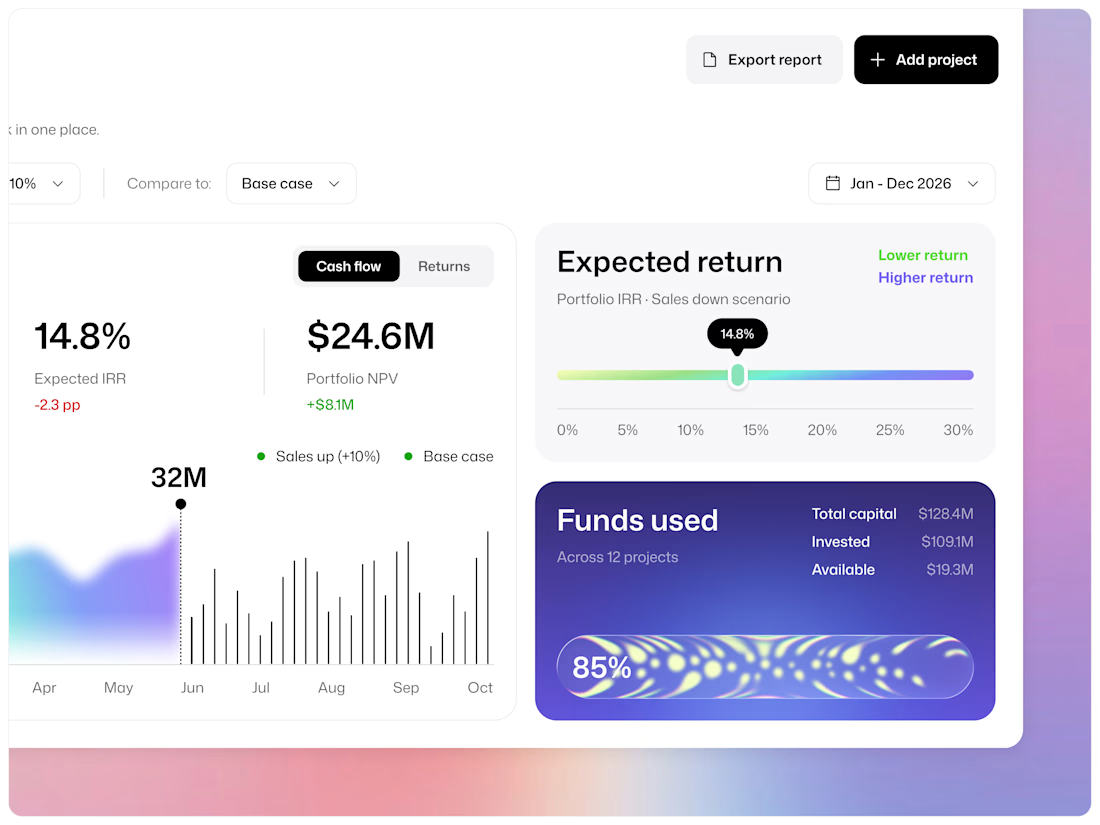
In one “Sales up” scenario, portfolio value grows by 6.2% while IRR drops by 2.3 percentage points. The dashboard makes this trade-off visible so teams can consider the full picture before making a decision.
Numbers stay calm and easy to read. Color is reserved for meaningful differences, including return ranges, cash flow, and invested capital. The mobile view brings the portfolio into one list, with light and dark modes.
This is a self-initiated exploration shaped by our experience with investment and banking projects, most of which are covered by NDA.
For fintech teams, what’s the first number you check on Monday morning?
Emote is a UX/UI design studio for fintech, SaaS, health tech, and AI products. Get in touch to discuss your project and see how we approach our work.