The network for creativity
Join 1.25M professional creatives like you
Connect with clients, get discovered, and run your business 100% commission-free
Creatives on Contra have earned over $150M and we are just getting started
Back to feedPost

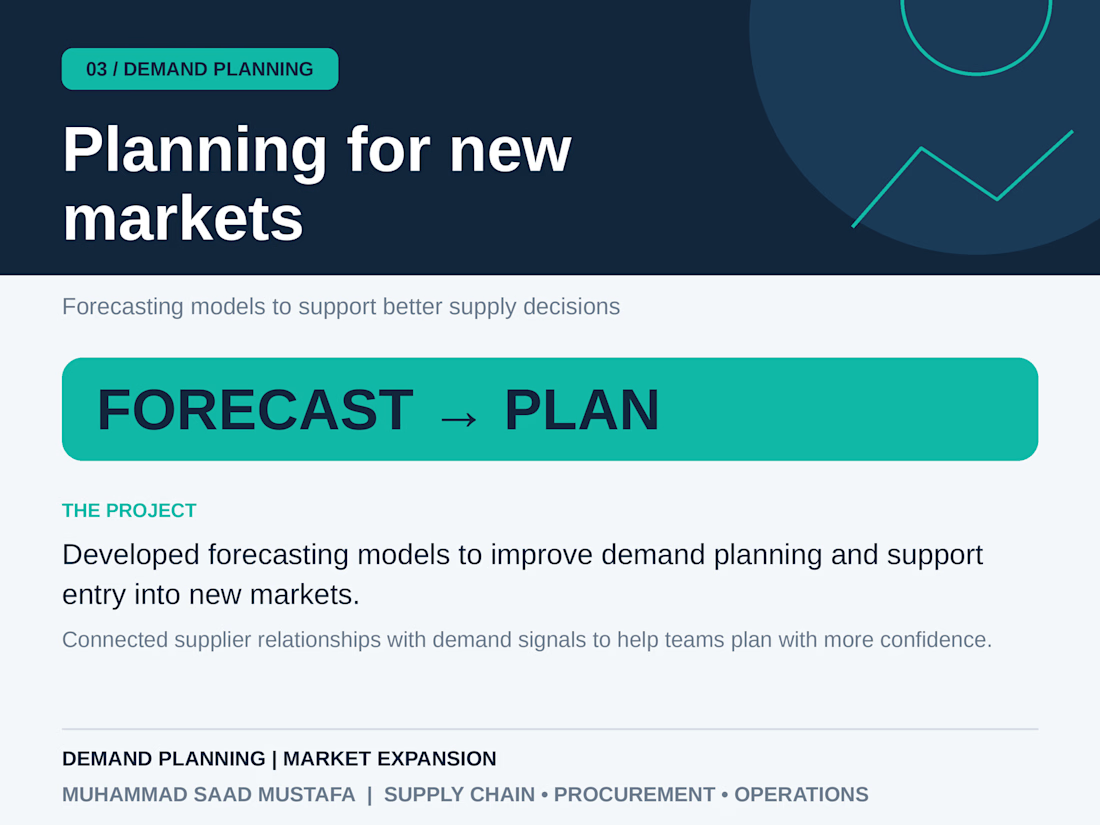
I developed forecasting models to improve demand planning and support entry into new markets. This work brought together forecasting and supplier partnerships to support supply decisions as the business expanded.

The network for creativity
Join 1.25M professional creatives like you
Connect with clients, get discovered, and run your business 100% commission-free
Creatives on Contra have earned over $150M and we are just getting started



Related posts

Elevator Looks | AI Fashion Reel 🔥
For this project, I wanted to reinterpret a familiar trend through my own styling and attention to detail.
Five distinct looks, one model, and a consistent setting. I developed the character’s appearance, curated the outfits, and worked on lighting and movement to give each look its own mood while keeping the film cohesive.
From reference preparation to AI generation and final editing, I handled the full creative process.
Tell me about your idea — let’s create somethingspecial together! 😊


It's really cute

This video demonstrates an interactive inventory analytics application designed to help operations teams monitor stock availability, identify supply shortages, and make informed replenishment decisions.
Using 16 populated synthetic inventory records, the walkthrough demonstrates how changes in stock quantities and supplier lead times automatically update inventory risk calculations.
What the Video Demonstrates
Inventory Dashboard: Displays stock availability, six stockout-risk items, and seven replenishment candidates.
Stockout Risk Detection: Identifies products that may run out before replacement inventory arrives.
Supplier Delay Simulation: Demonstrates how changing lead times affects replenishment calculations and risk exposure.
Interactive Inventory Management: Shows how stock adjustments immediately update dashboard metrics.
Replenishment Analytics: Calculates reorder points using demand, lead time, and safety stock.
Reporting: Provides calculated inventory results and export capabilities.
Technical Implementation
Developed the interactive dashboard, inventory calculation logic, scenario controls, risk filtering, and data import/export functionality using JavaScript, HTML5, and CSS3.
The demonstration showcases a functional inventory management analytics application with reproducible calculations and clearly identified synthetic data.


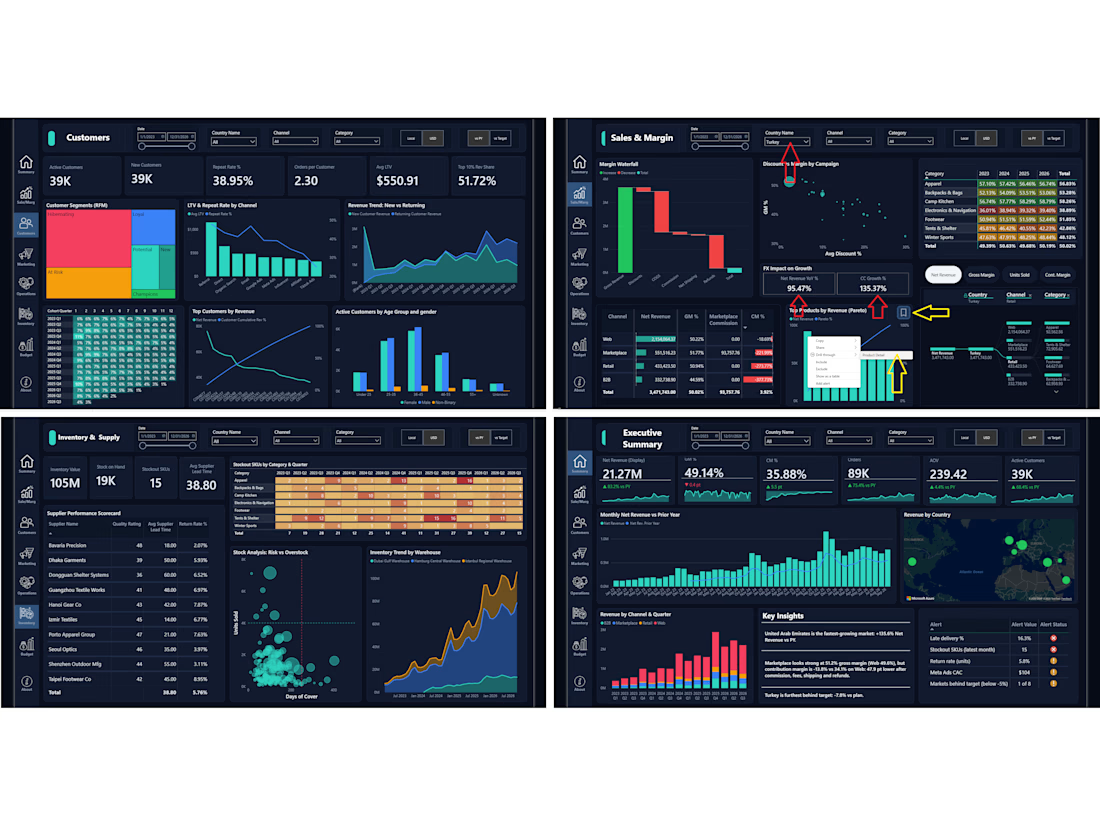
Excited to share my latest 10-page Power BI Executive Dashboard! 📊✨
From Star Schema data modeling and 90+ advanced DAX measures to Customer Cohorts, Marketing Funnels, and Inventory Health Quadrants—here is how I turned 150K+ raw order lines into an interactive executive app.
Check out the full case study below (and reach out if you need custom BI solutions!): 👇
https://contra.com/p/OXEUr6EM-multi-channel-e-commerce-and-supply-chain-power-bi-dashboard