The network for creativity
Join 1.25M professional creatives like you
Connect with clients, get discovered, and run your business 100% commission-free
Creatives on Contra have earned over $150M and we are just getting started
Back to feedPost

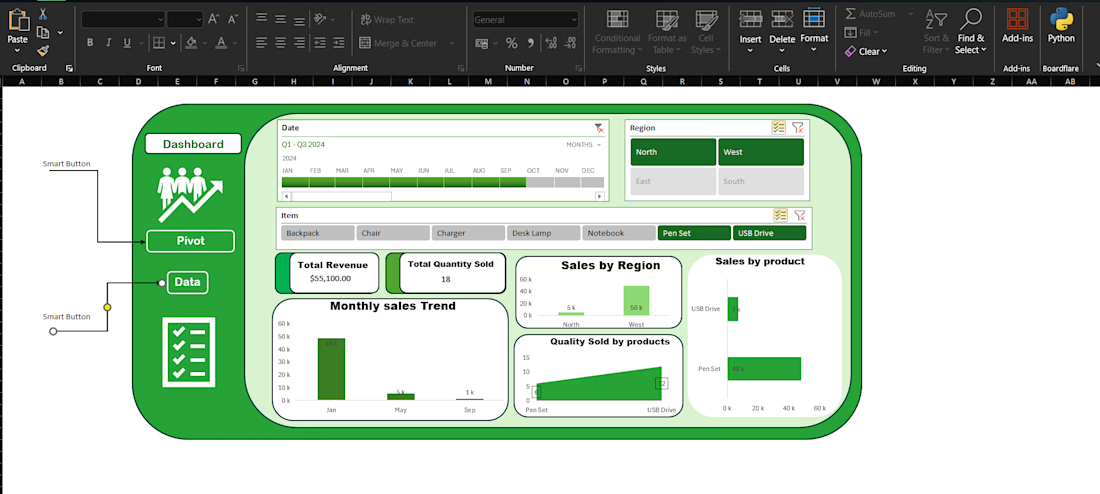
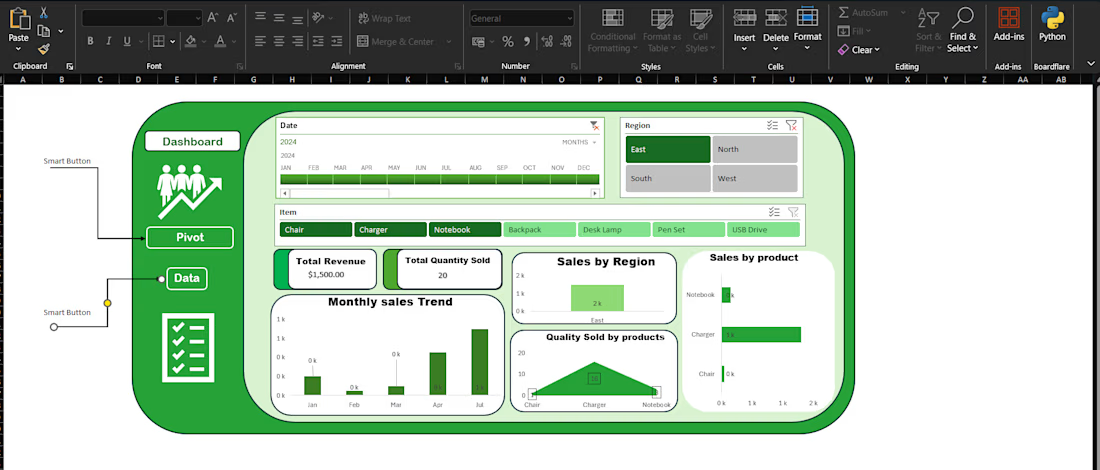
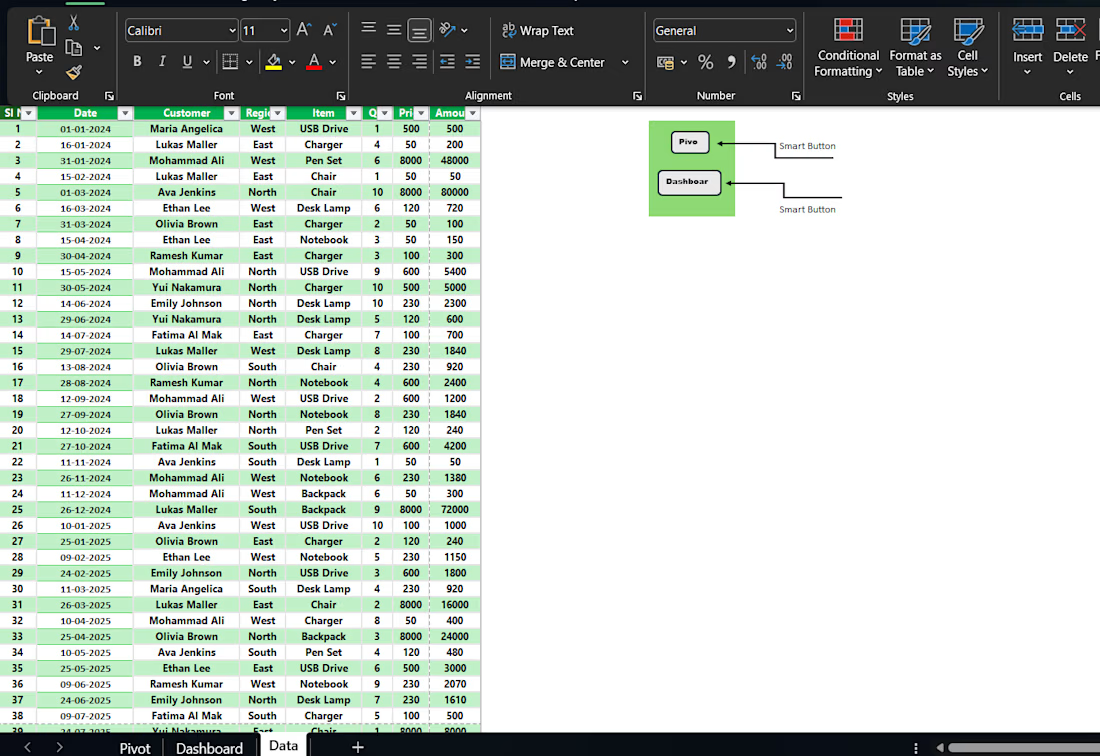
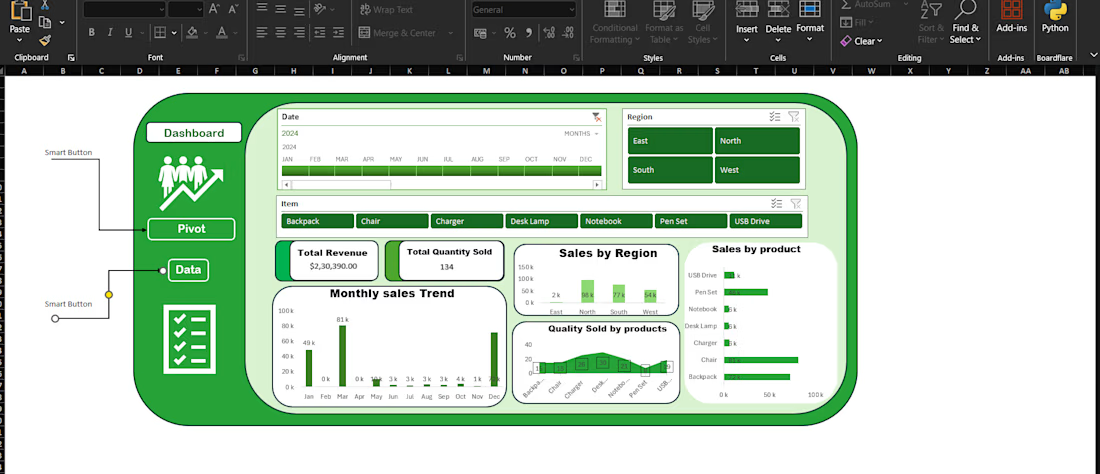
Interactive Excel Sales Dashboard [Sample]
A dynamic Excel dashboard built with PivotTables, slicers, and charts to analyze sales performance across regions, products, and time periods. This project includes a structured data sheet and an interactive dashboard layout that makes it easy to filter data, review trends, and track key business insights at a glance. An interactive Excel dashboard created with PivotTables, slicers, and charts to visualize sales by region, product, and month.


The network for creativity
Join 1.25M professional creatives like you
Connect with clients, get discovered, and run your business 100% commission-free
Creatives on Contra have earned over $150M and we are just getting started








Related posts


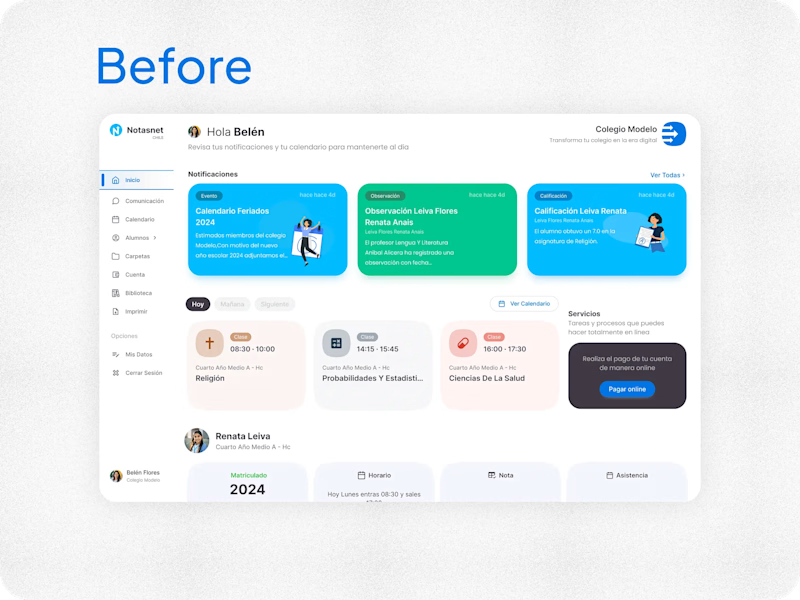
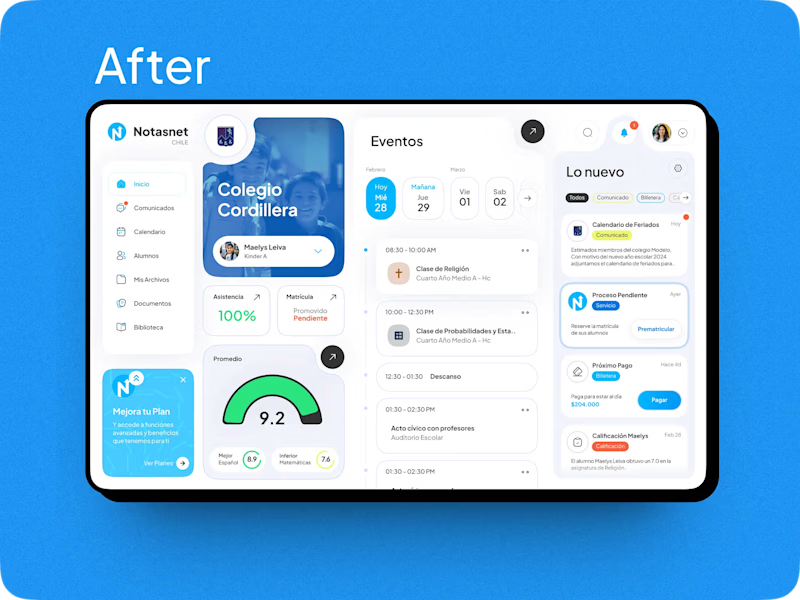

After absolutely it's more practical 🎉🎉🔥🔥

Episode #6: The bank balance is NOT your profit.
“I have AED 250,000 in the bank, so I’m doing great.”
Not necessarily. Look at what’s actually inside that balance:
🟣 AED 100,000 is a bank loan. You have to pay it back.
🟡 AED 60,000 is customer advances. You haven’t delivered the work yet.
🔵 AED 15,000 is VAT collected. It belongs to the tax authority.
🔵 AED 45,000 is your own capital that you put in.
🟢 AED 30,000 is the actual profit.
Cash and profit are different things, for three reasons:
1️⃣ Timing. An invoice you’ve sent is profit, but it isn’t cash until the customer pays.
2️⃣ Non-cash costs. Depreciation lowers your profit, but no money leaves the bank.
3️⃣ Not your money. Loans, advances, VAT and capital all add to your balance without adding to your profit.
Profit = Revenue earned − Expenses incurred.
Earned ≠ received. Incurred ≠ paid.
Before you spend, ask:
✅ Did customers pay me, or did I only invoice them?
✅ Is any of this a loan, advance, VAT or my own capital?
✅ Which bills and taxes are still due?
✅ What is my real profit this month?
If you can’t answer these, your bank balance is giving you a false picture of how the business is doing.
Next up: Episode 7. Follow along so you don’t miss it.
Counting Crux |
#Accounting #UAEBusiness #Profit #CashFlow #Bookkeeping #Founders #DubaiBusiness #SmallBusiness


Cash flow and profitability are two different things. Understanding where your money comes from and where it needs to go is essential for making smarter business decisions.

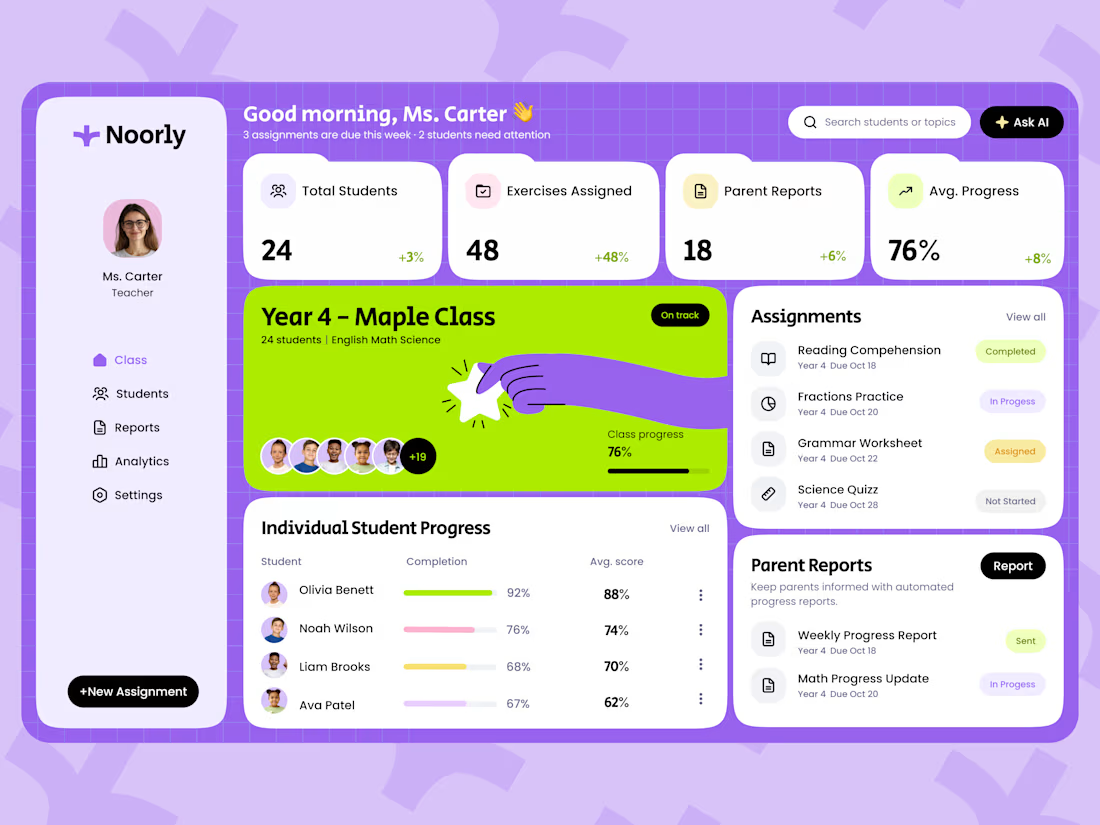
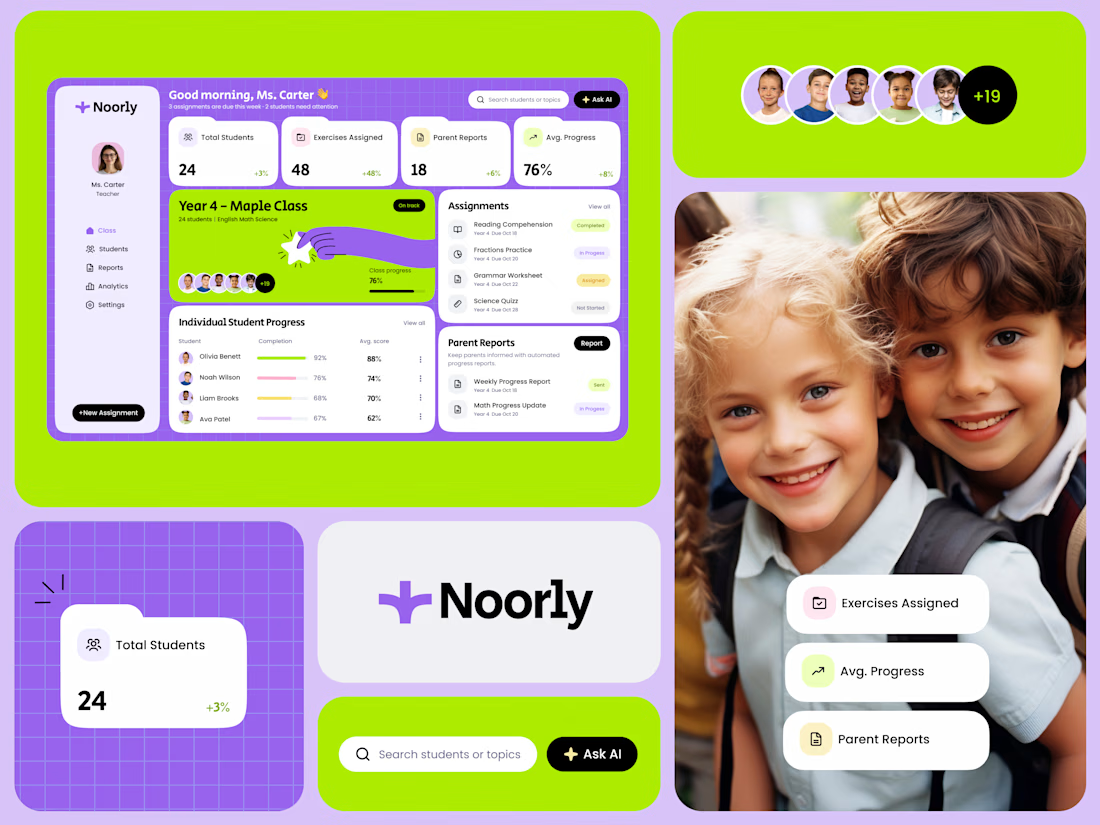
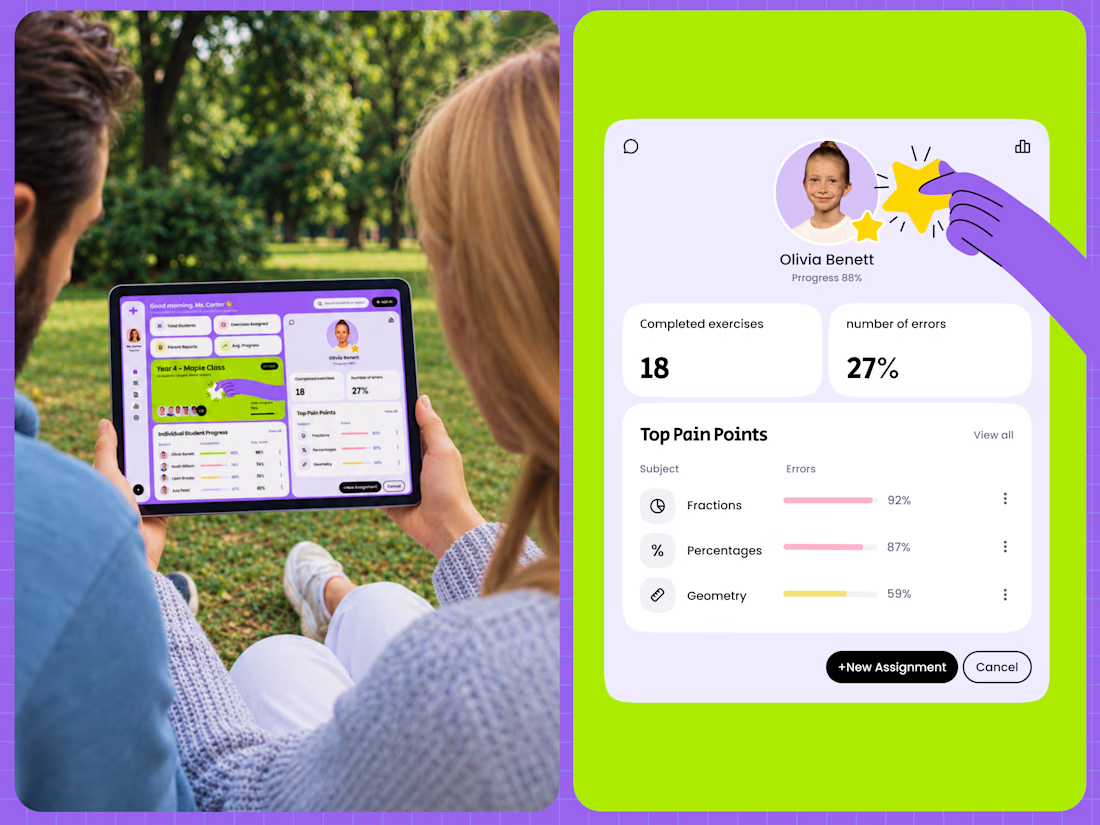
Noorly is a modern EdTech SaaS dashboard designed for teachers, students, and parents.
The platform brings classroom management, assignments, student analytics, performance reports, and parent communication into one cohesive experience. The design combines a playful purple and lime green color palette with soft pastel tones, rounded cards, and clear data visualizations.
The goal was to make complex educational information easier to navigate while helping teachers save time and make more informed decisions.
View the project:
https://dribbble.com/shots/27817401-Dashboard-Education-SaaS