The network for creativity
Join 1.25M professional creatives like you
Connect with clients, get discovered, and run your business 100% commission-free
Creatives on Contra have earned over $150M and we are just getting started
Back to feedPost

PDF → EXCEL | DATA CONVERSION
The real cost of PDFs isn’t accuracy — it’s time.
Every time someone copies tables, rechecks totals, or rebuilds the same sheet, hours quietly disappear. Not once, but every week.
I’ve seen teams redo the same work simply because the data never moved into a reusable, structured format. Once it does, the rework stops — and decisions speed up.
How often do you see the same data rebuilt again and again in your workflow?
The network for creativity
Join 1.25M professional creatives like you
Connect with clients, get discovered, and run your business 100% commission-free
Creatives on Contra have earned over $150M and we are just getting started











Related posts

Messy data in, clean results out. 🎥 A quick look at my work as a virtual assistant: data entry, B2B lead lists, PDF to Excel, CRM cleanup and research, with healthcare-level accuracy. Send me a message to get started.

Hi everyone! 👋
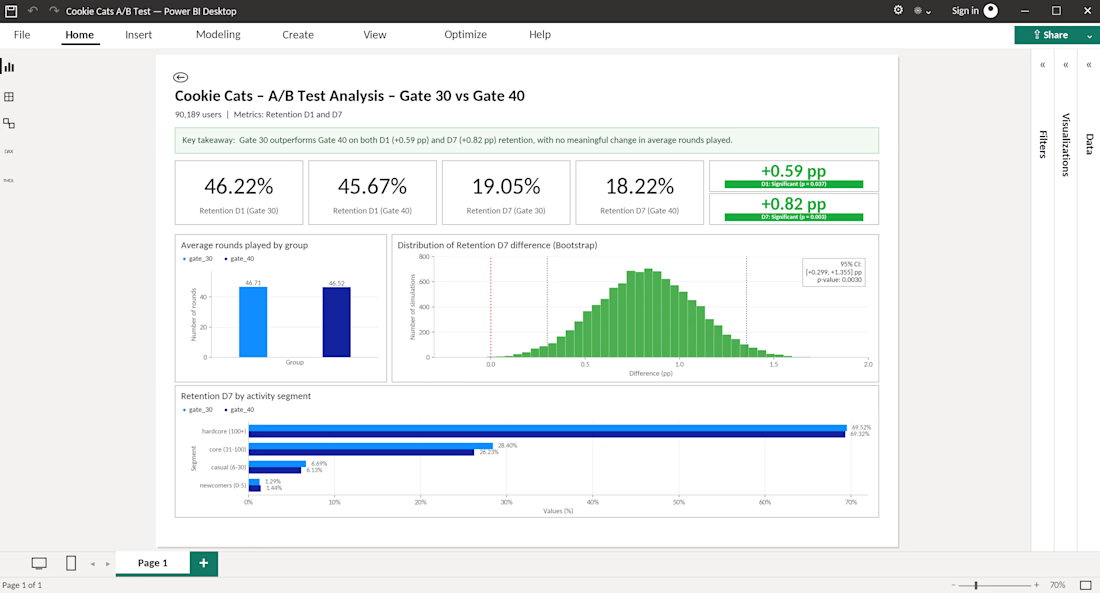
I'm Anastasiia, a Product Analyst with experience in mobile games and a background in business analytics.
I enjoy exploring user behavior, finding patterns in data, and turning numbers into insights that help teams make better product decisions.
🛠️ What I work with:
- SQL (BigQuery, PostgreSQL)
- Python (Pandas, NumPy)
- Product metrics, funnels, and cohort analysis
- Retention and A/B testing
- Data visualization and dashboards
I'm currently expanding my portfolio and open to freelance projects involving data analysis, SQL queries, reporting, and product analytics.
Looking forward to connecting with other data professionals and collaborating on interesting projects!
#DataAnalytics #ProductAnalytics #SQL #Python



nice work

I stopped reading my inbox manually.
Every client email I get now lands automatically in a Google Sheet — sender, subject, time, sorted. No copy-paste, no missed leads.
I built it with Make + a simple workflow, and now I set up the same system for other freelancers and small businesses: your Gmail → your Sheet, running 24/7 while you sleep.
What's the one boring task in your business you'd automate first? 👇
