The network for creativity
Join 1.25M professional creatives like you
Connect with clients, get discovered, and run your business 100% commission-free
Creatives on Contra have earned over $150M and we are just getting started
Back to feedPost

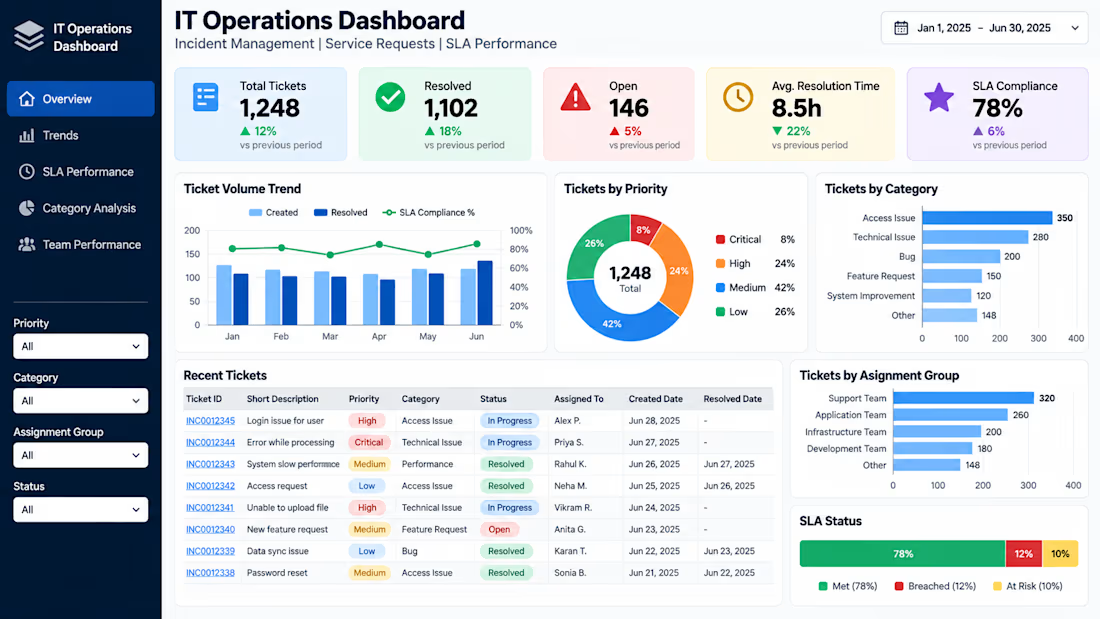
I created a professional Excel-based IT Operations Dashboard to transform raw ticket data into actionable insights. The dashboard tracks ticket volume, resolution trends, priority and category distribution, assignment groups, and SLA performance. It includes interactive filters and KPI cards for Total Tickets, Resolved, Open Tickets, Average Resolution Time, and SLA Compliance, helping teams quickly monitor operational performance and identify areas requiring attention.


The network for creativity
Join 1.25M professional creatives like you
Connect with clients, get discovered, and run your business 100% commission-free
Creatives on Contra have earned over $150M and we are just getting started





Related posts

I designed and developed a Spotify-inspired Music Analytics Dashboard in Microsoft Power BI, combining data modelling, DAX, interactive navigation, and custom dashboard design into a single analytical experience.
The dashboard allows users to explore music data from different perspectives — from overall performance and popularity to individual artists, songs, albums, and trends over time.
What I built
- Overview Dashboard — high-level KPIs and music performance trends
- Artist Analytics — artist rankings, song counts, popularity and catalogue analysis
- Song Analytics — song popularity, duration, year-wise analysis and album insights
- Interactive Navigation — seamless movement between dashboard sections
- Dynamic Visual Analysis — monthly trends, popularity patterns and category comparisons
- Detailed Data Tables — deeper exploration beyond summary-level KPIs
- Spotify-inspired UI — dark, modern interface designed around the visual identity of a music streaming platform
Key metrics explored
- 342 Artists
- 789 Distinct Songs
- 562 Albums
- Average Song Duration: 3.28 minutes
- Average Popularity: 90
Tools & Skills
Power BI · DAX · Data Modeling · Data Visualization · Interactive Dashboard Design · KPI Development · Business Intelligence
The goal wasn't simply to create another Power BI report — it was to make the data explorable, intuitive and visually engaging.
Interested in turning your own data into an interactive Power BI dashboard? Let's connect.

Welcome! Are you looking to turn messy data into clear, actionable insights? You're in the right place.
As a professional data analyst, I specialize in transforming raw data into clean, structured, and visually compelling dashboards that help businesses make smarter decisions.
What I Offer:
• Data Cleaning & Preparation (Handling missing values, removing duplicates, formatting)
• Exploratory Data Analysis (EDA) to find key trends and patterns
• Interactive Dashboards & Reports (Power BI/ Excel)
• Custom DAX / SQL queries for deep metric tracking
• Professional summary report with key business insights
Tools I Use:
• Power BI
• Python & SQL
• Advanced Excel & Google Sheets
Why Choose Me?
• High-quality, clean design with user-friendly layouts
• Fast turnaround time and clear communication
• 100% satisfaction guarantee
Let's unlock the story behind your data! Please contact me before placing an order so we can discuss your specific project goals.


Agent Evaluation Dashboard — Full-Stack LLM Observability Tool
Teams running AI agents in production need visibility into how those agents actually perform not just whether they respond, but how accurate, fast, and cost-efficient they are. I built a full-stack observability dashboard to solve exactly that: a single place to track accuracy, latency, API cost, and schema compliance across multiple LLM models and agent types.
What I built
A responsive Next.js (App Router) frontend styled with Tailwind CSS — deep purple sidebar, live accuracy/latency charts (Recharts), filterable eval-run tables, and per-model performance comparisons
A Python FastAPI backend serving the dashboard's data layer, with token-based authentication protecting every route
Full session handling: login, protected pages, automatic redirect for unauthenticated users
A fully responsive layout collapsible drawer sidebar on mobile, reflowing grid on tablet/desktop


