The network for creativity
Join 1.25M professional creatives like you
Connect with clients, get discovered, and run your business 100% commission-free
Creatives on Contra have earned over $150M and we are just getting started
Back to feedPost

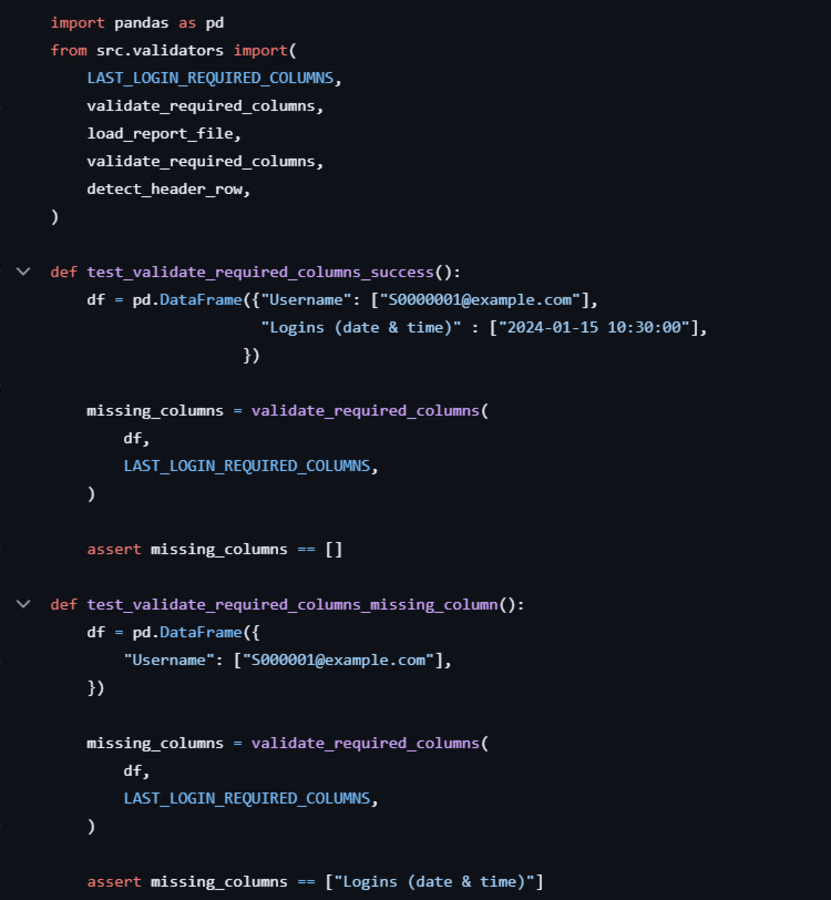
This project automates report processing for a business school. The main goal is to reduce the time spent manually processing information by simplifying the workflow to just a few clicks. In this case, a process that normally takes 15–30 minutes can now be completed in around 3 minutes.


The network for creativity
Join 1.25M professional creatives like you
Connect with clients, get discovered, and run your business 100% commission-free
Creatives on Contra have earned over $150M and we are just getting started







Related posts

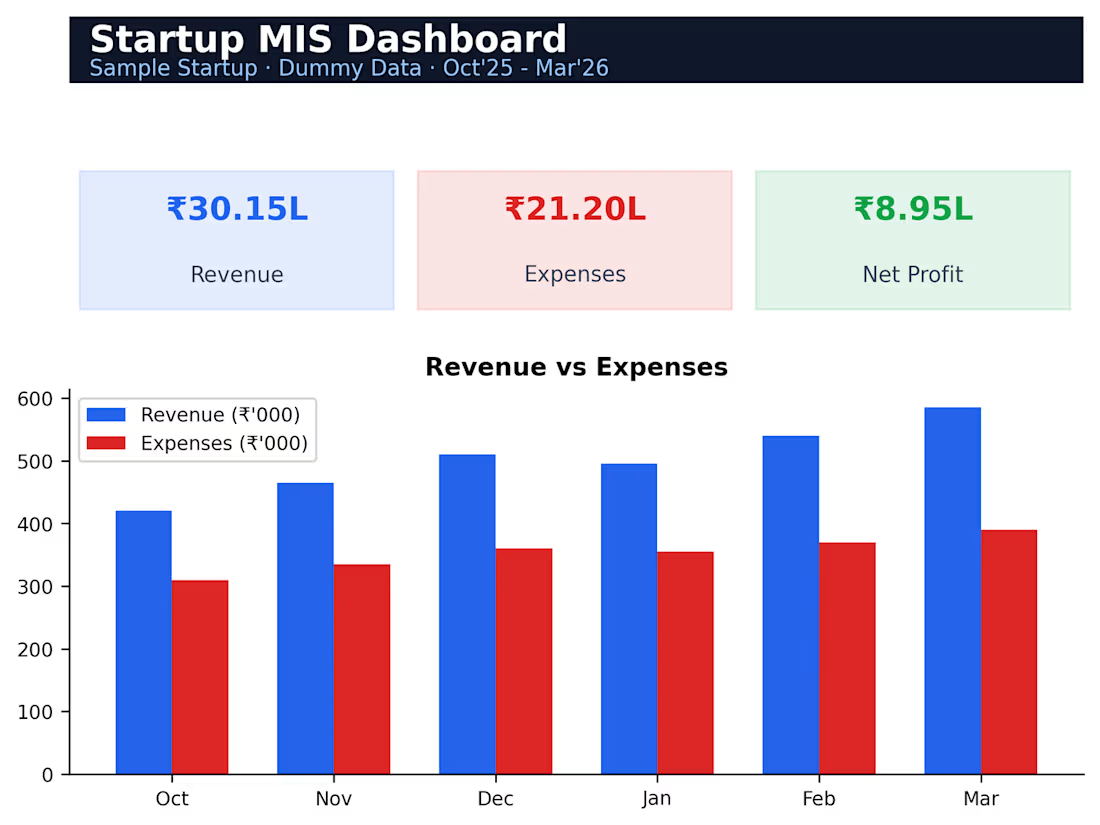
A 6-month MIS dashboard tracking revenue, expenses, net profit and margin trends with an auto-updating bar chart, giving founders a one-page view of business health.




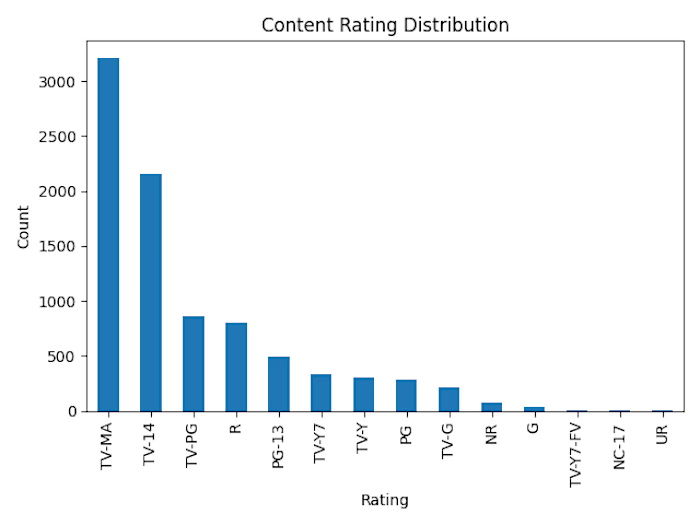
Performed exploratory data analysis on Netflix titles using Python to identify trends in content, genres, release years, countries, and ratings. Used Pandas and visualization libraries to clean, analyze, and present insights.